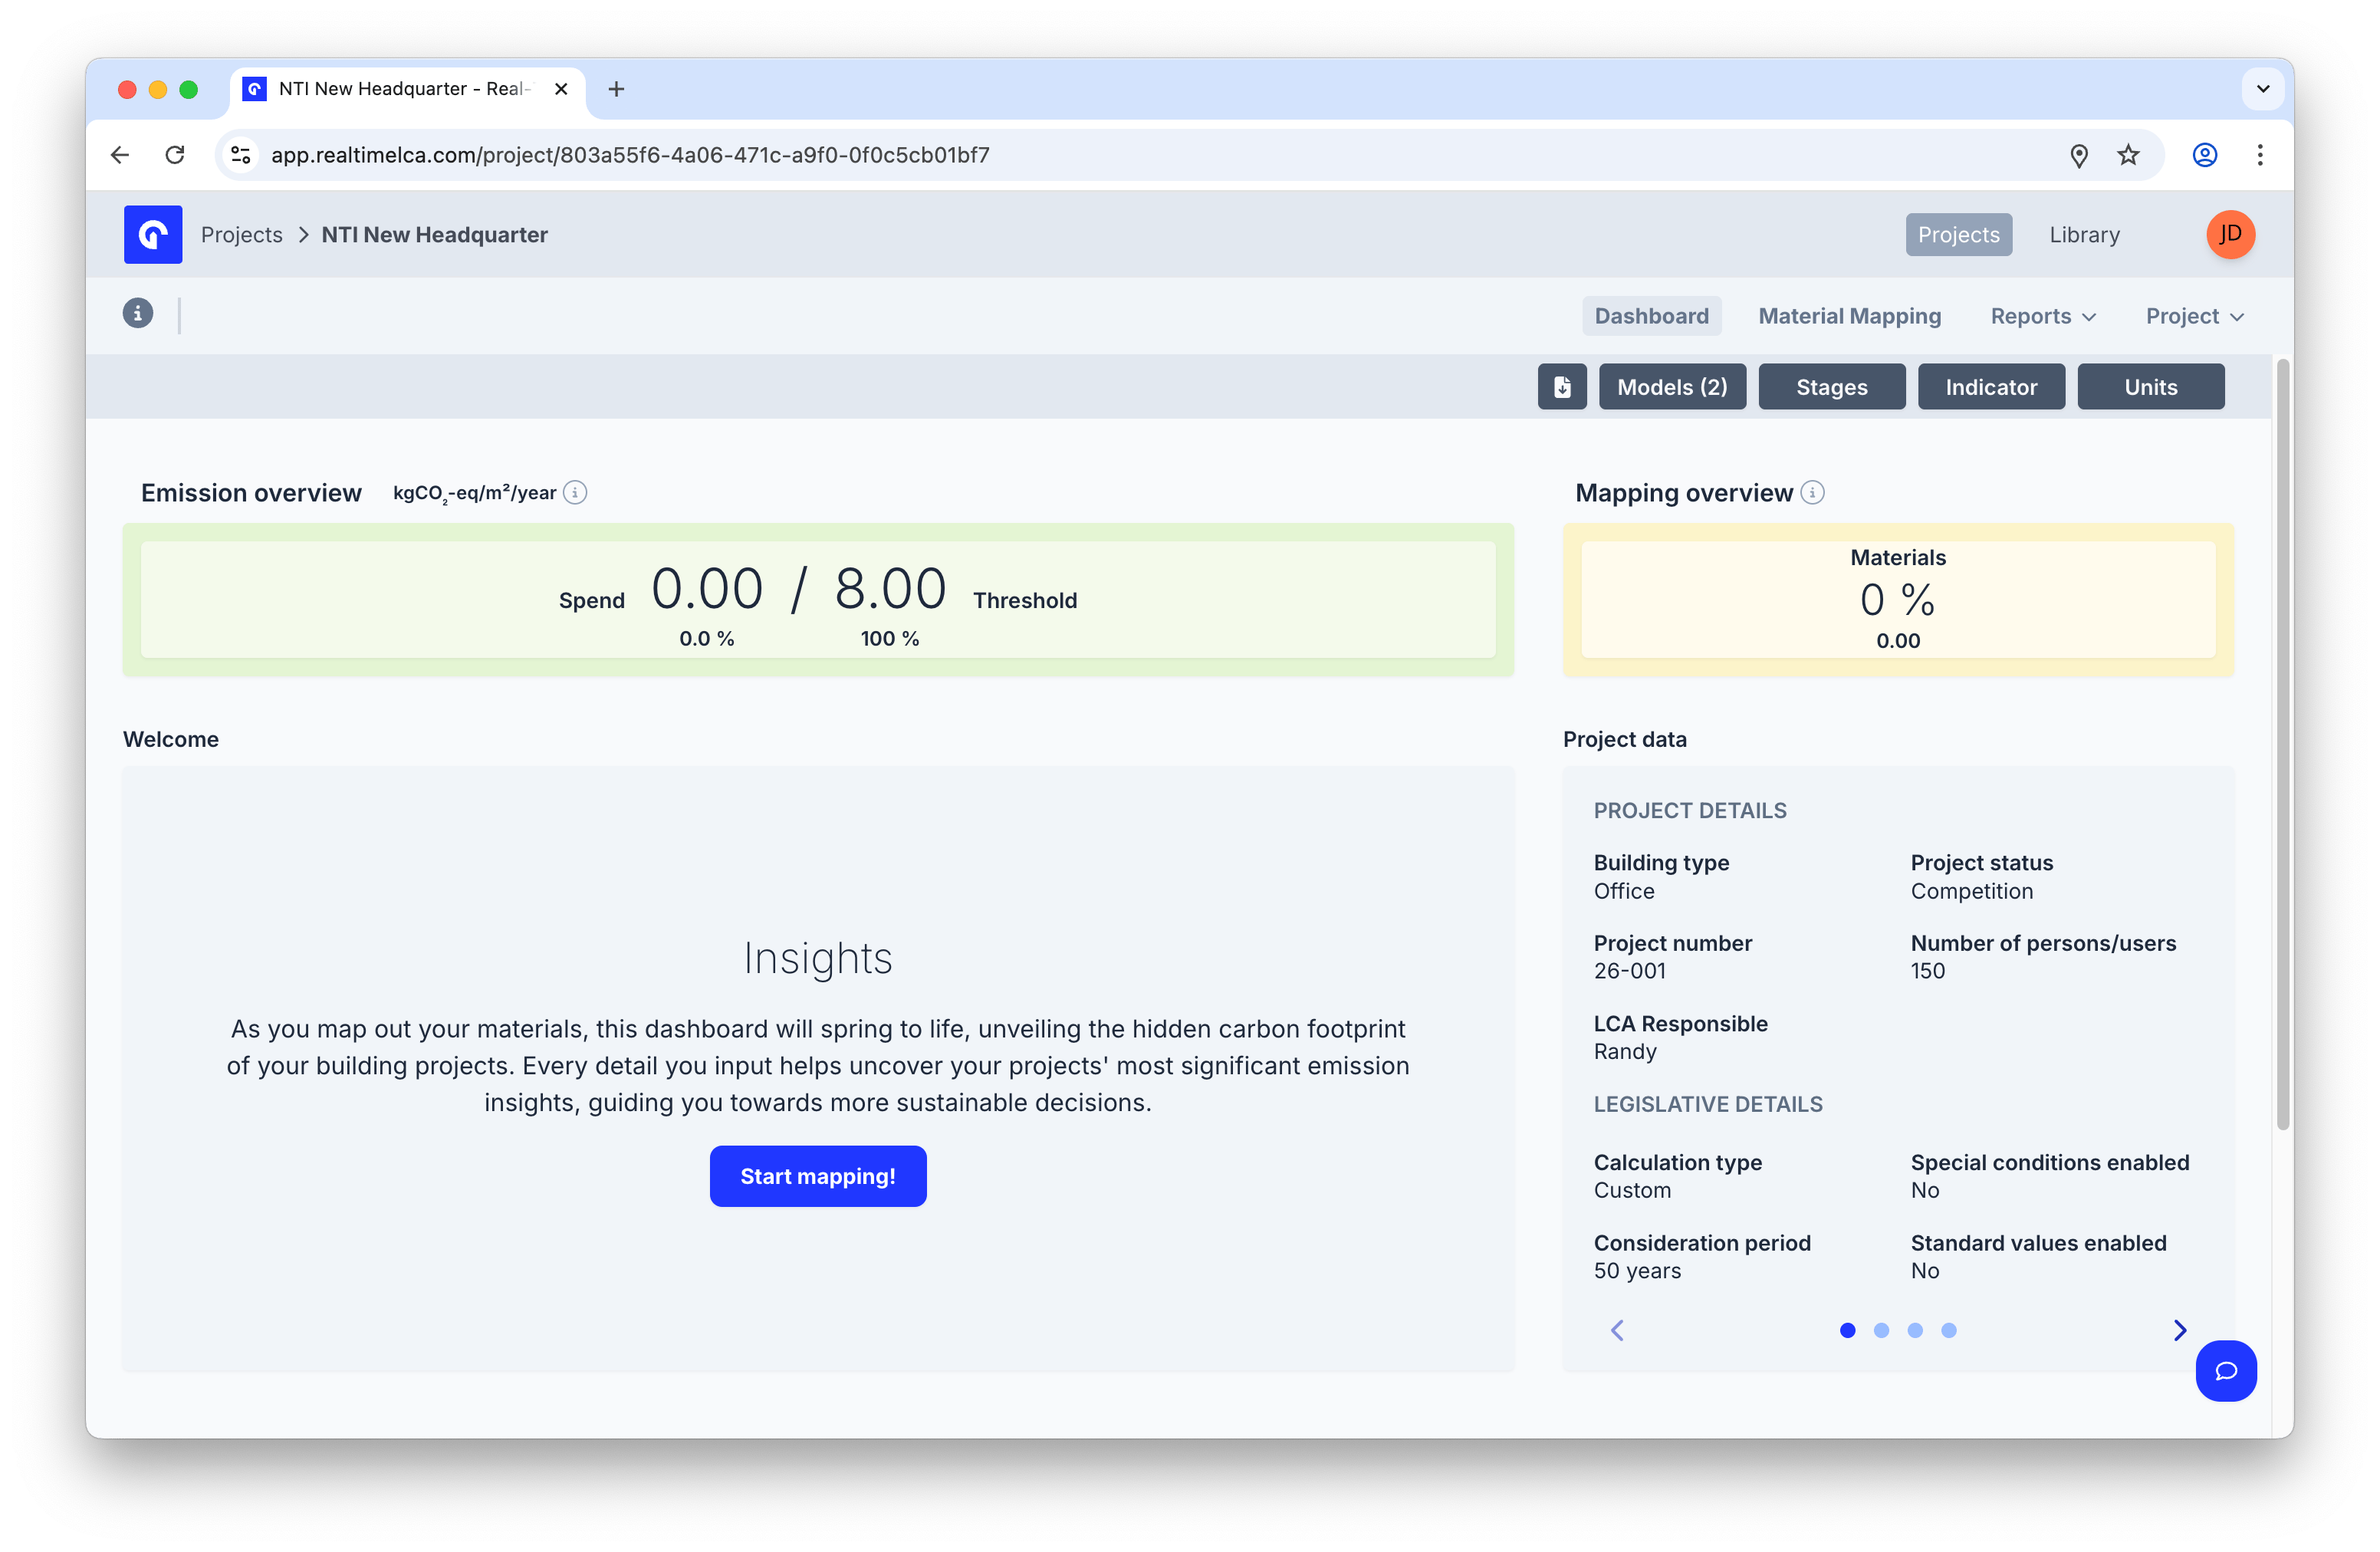
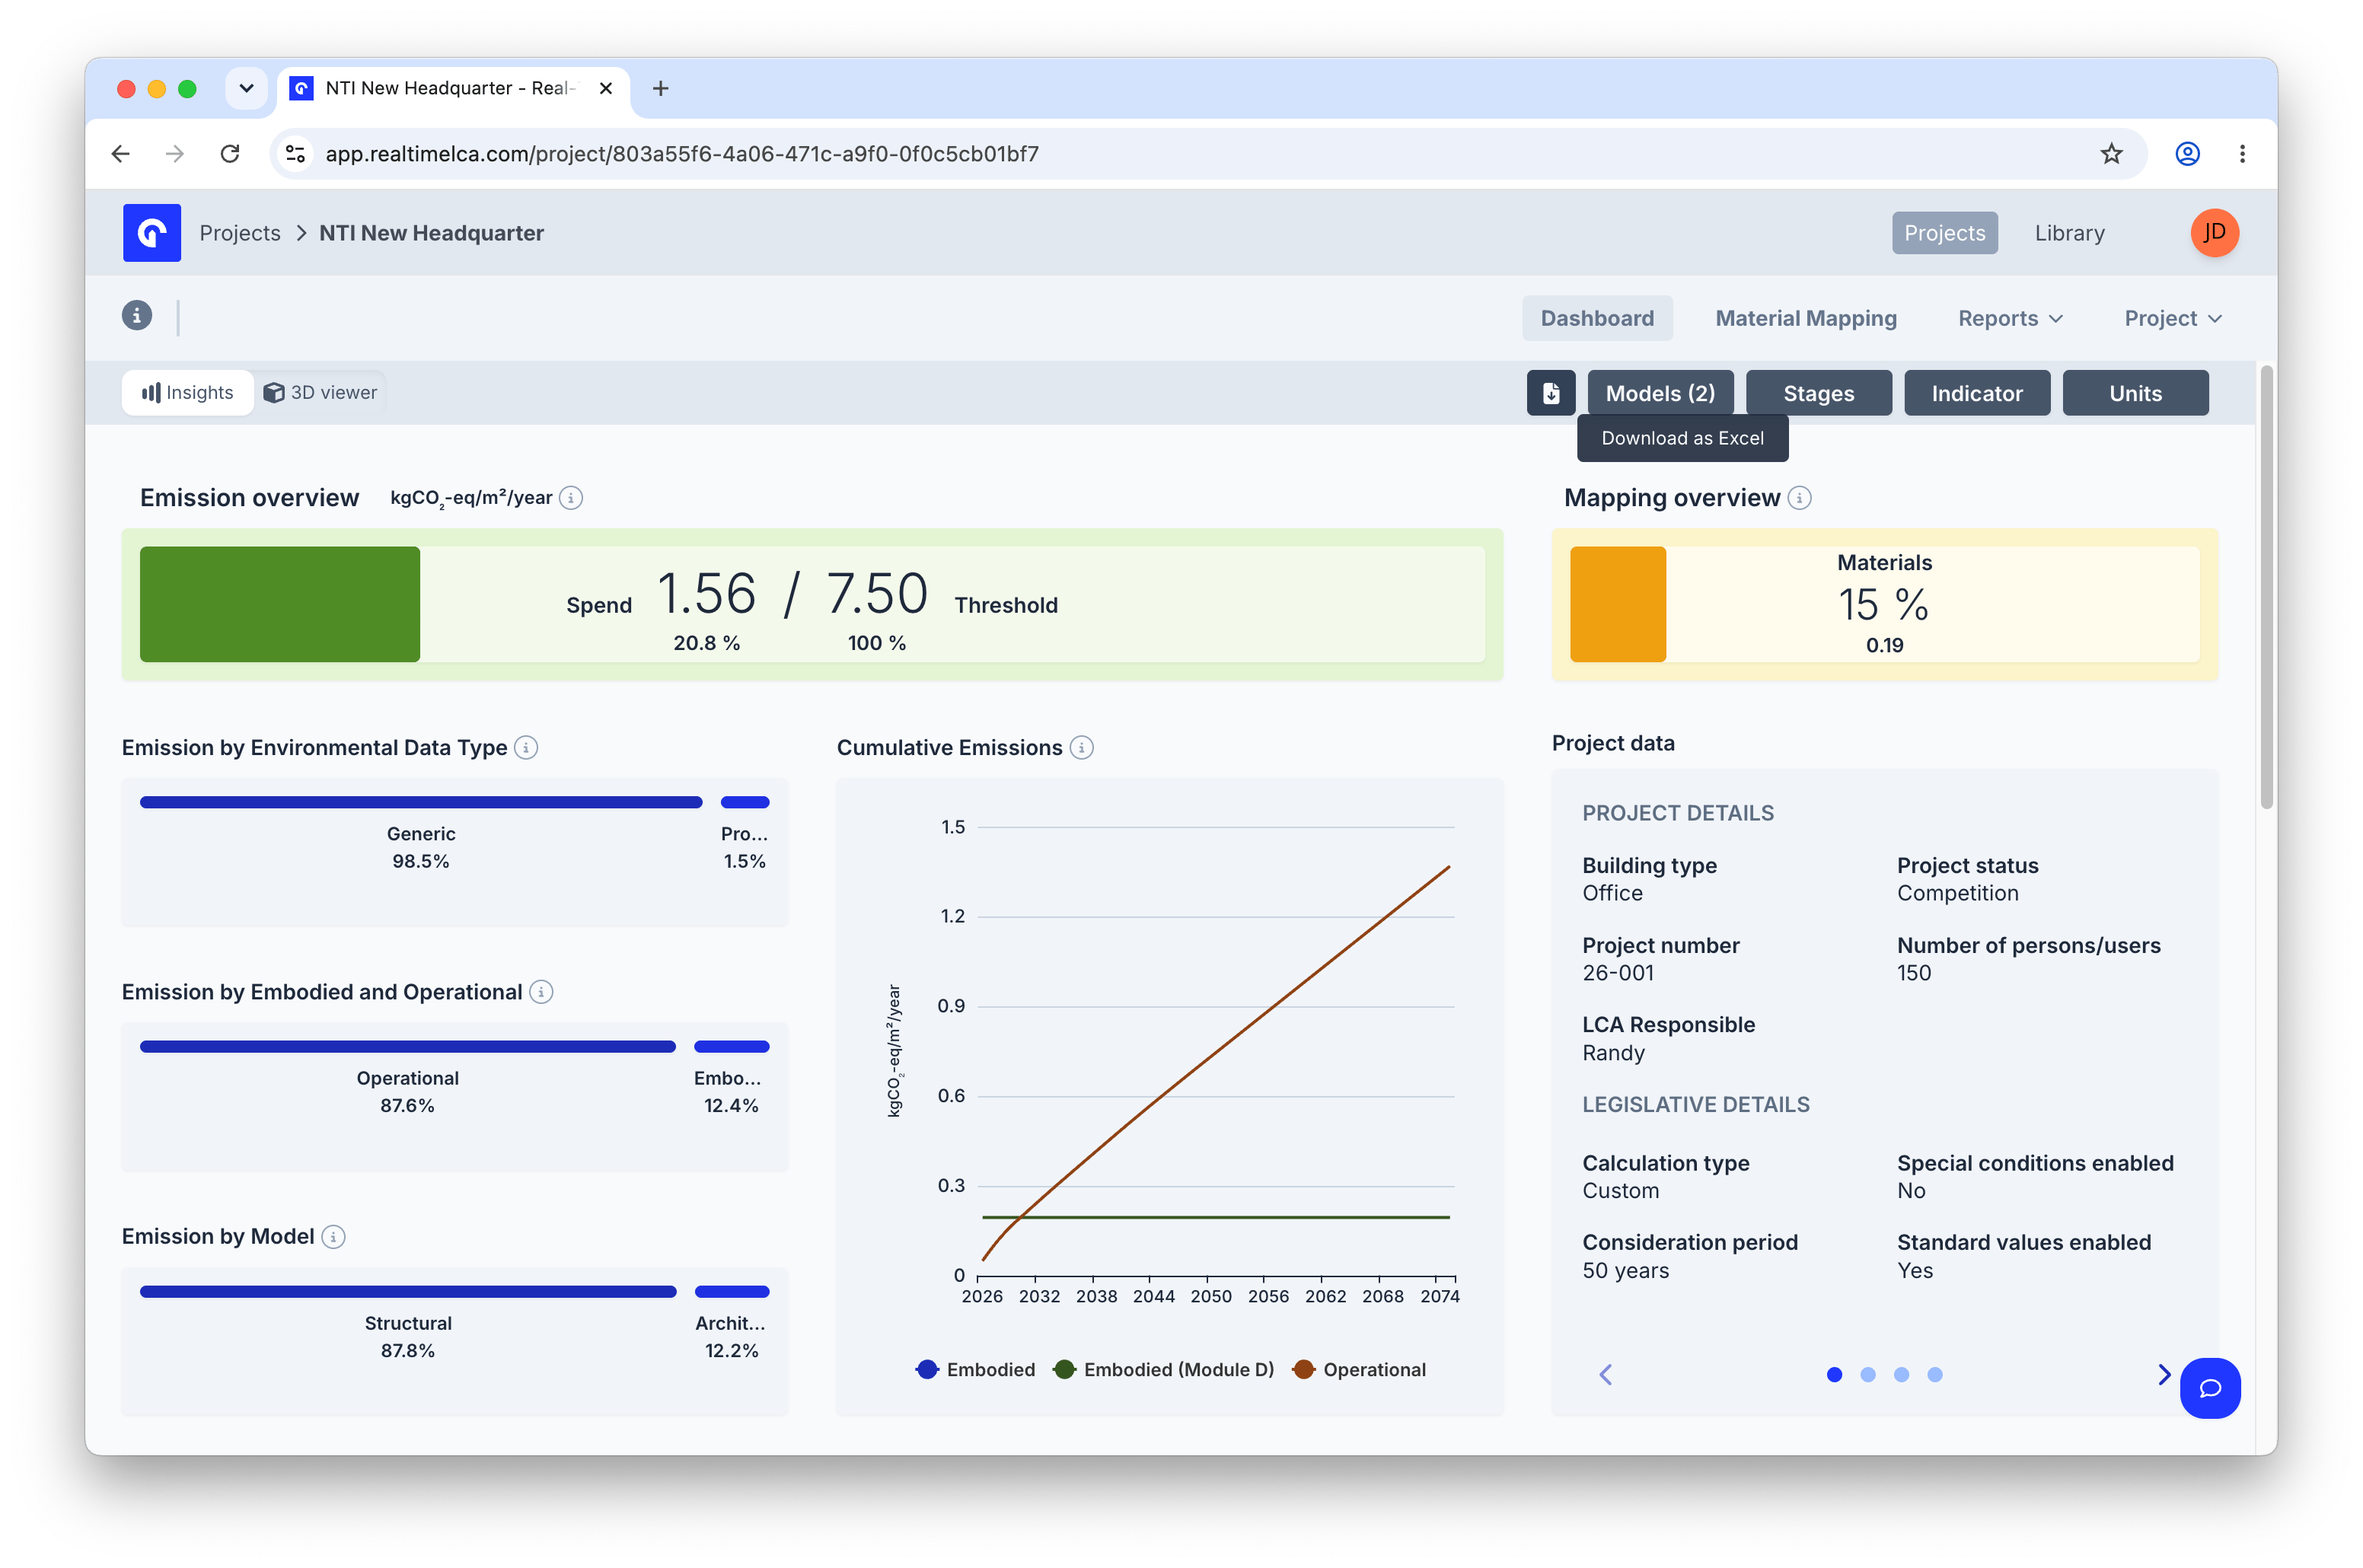
- Dashboard — emission and mapping overview, plus project data (the page above).
- Material Mapping — map model elements to materials.
- Transport Mapping — map transport for each material. Only visible when transport is required by the project’s framework or activated in Project Settings.
- Waste Sorting — classify waste flows. Only visible when waste sorting is required or activated in Project Settings.
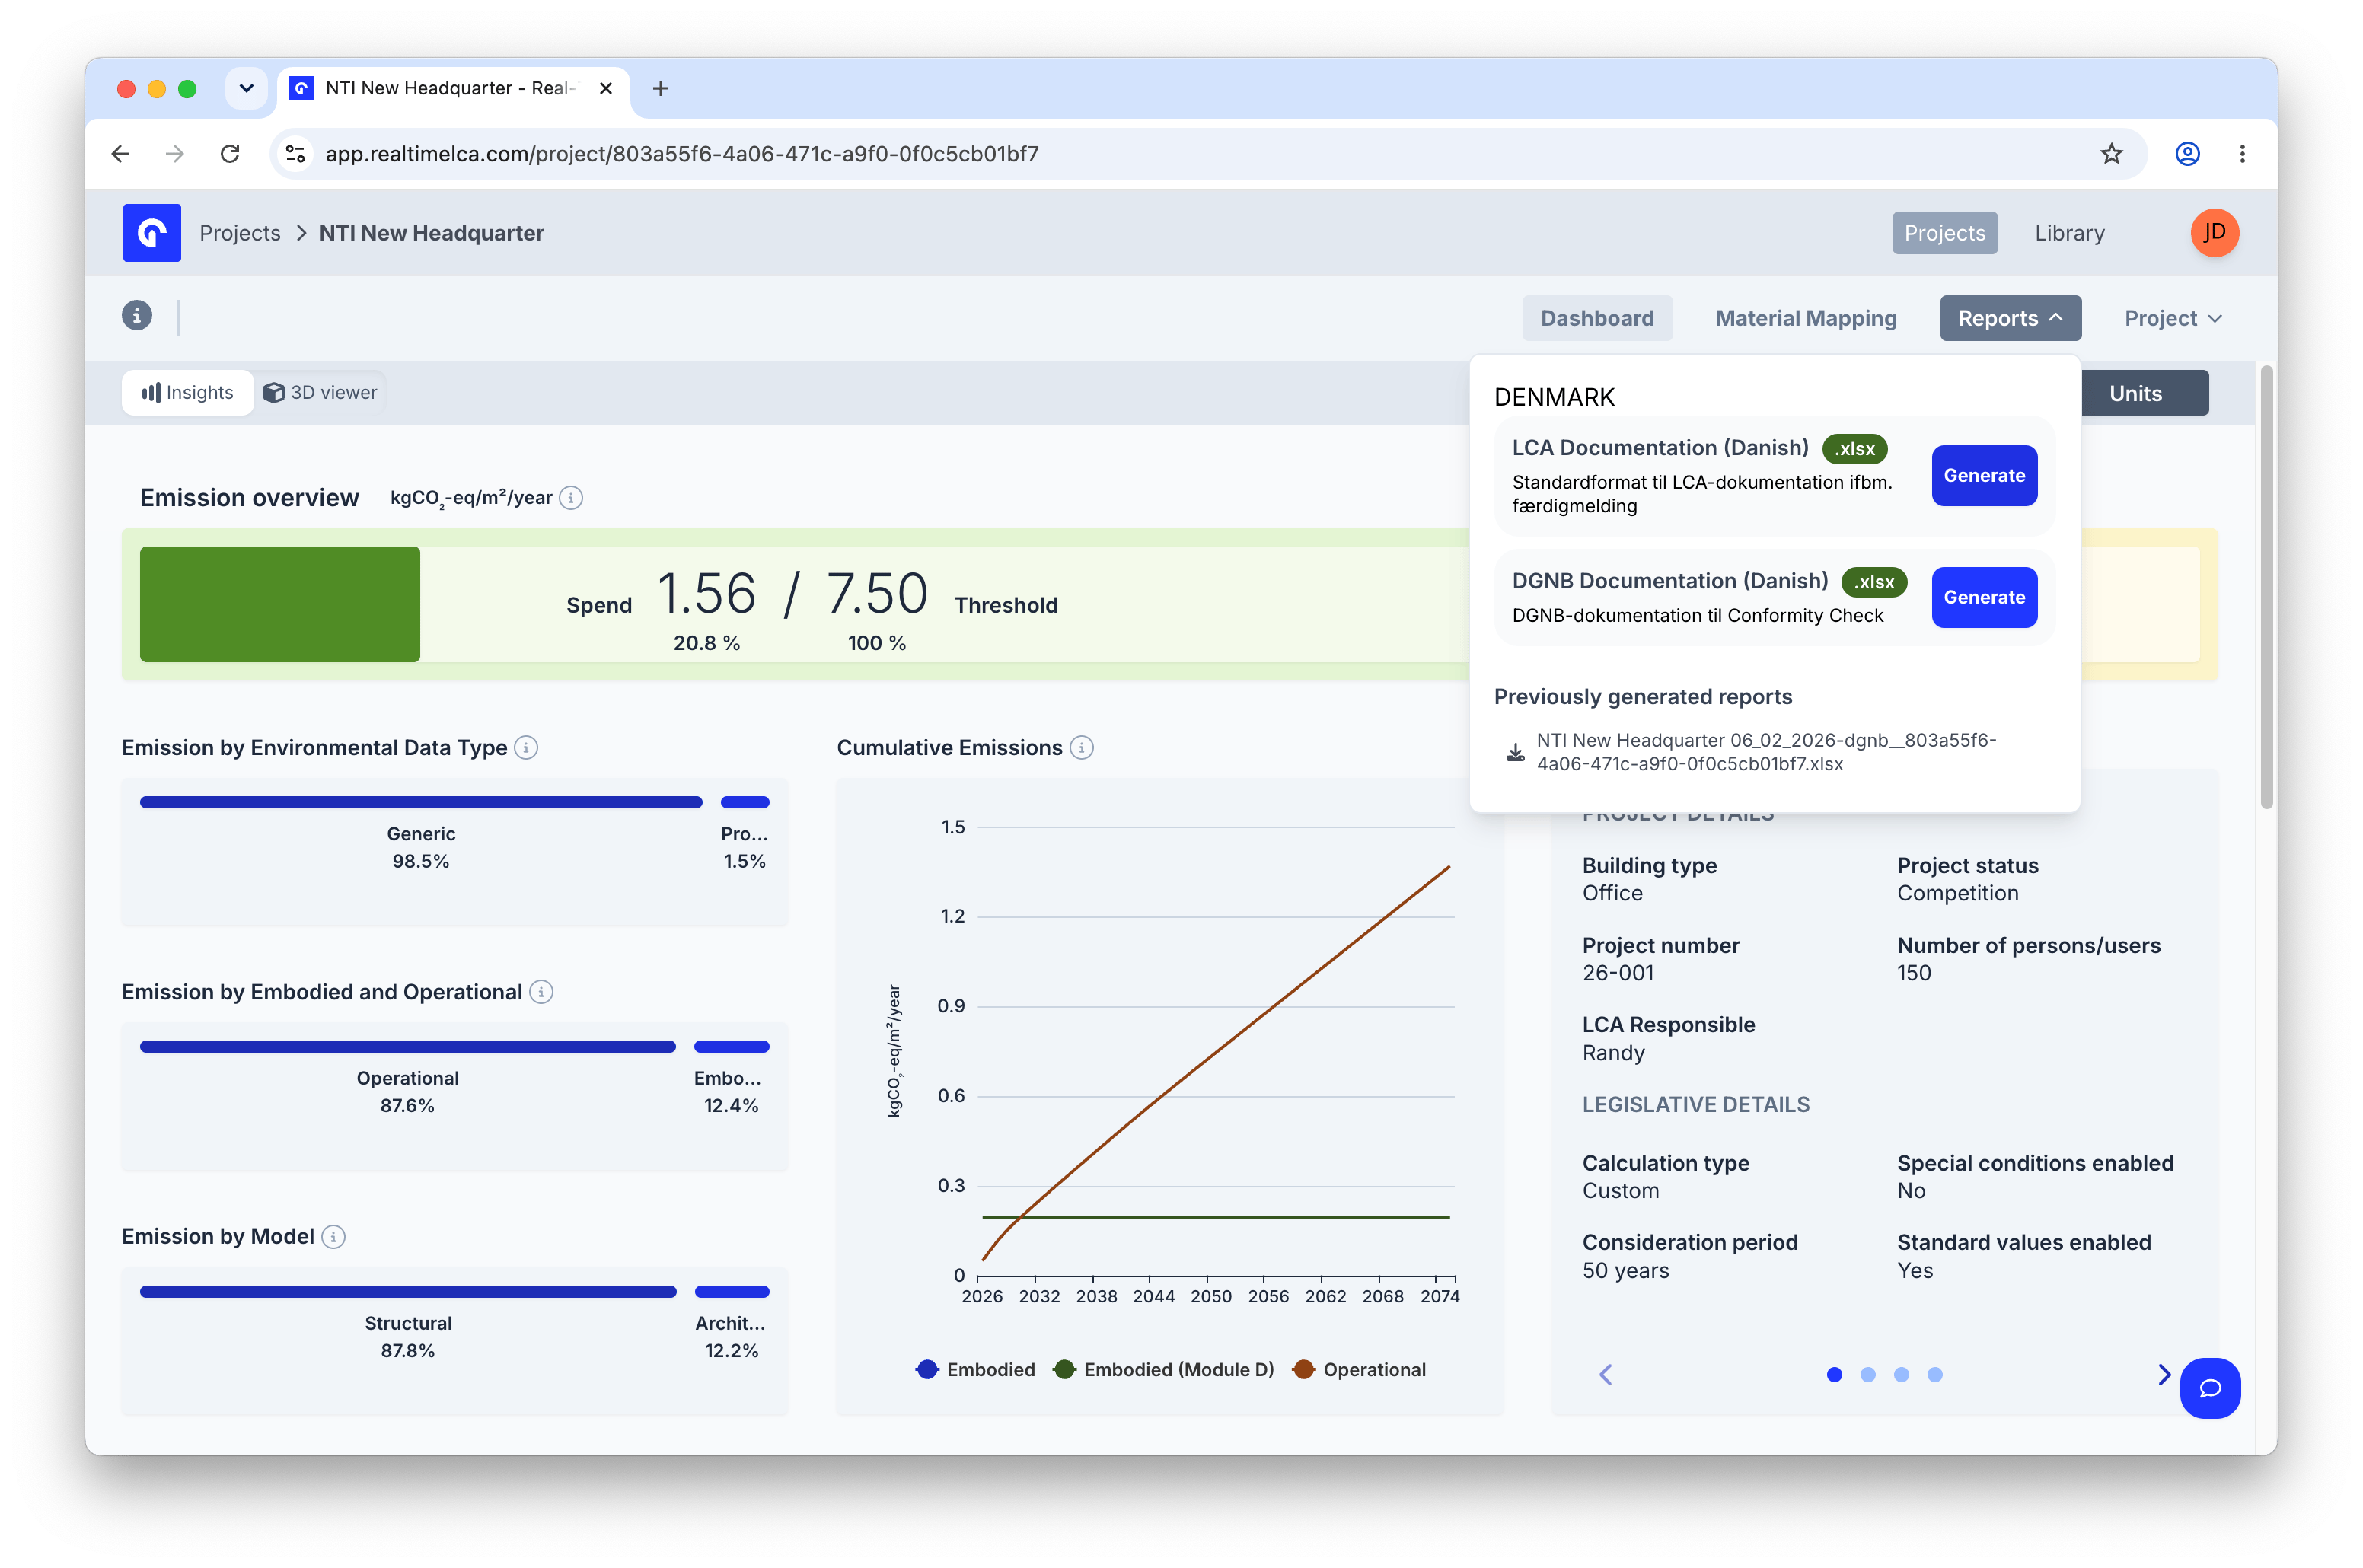
- Reports — generate documentation for the selected framework.
- Project — project-level actions (Manage Users, Edit, Clone, Delete).
Filters
The filters in the top-right of the dashboard scope every number and chart on the page. Selections persist while you switch between Insights and 3D viewer.Models filter
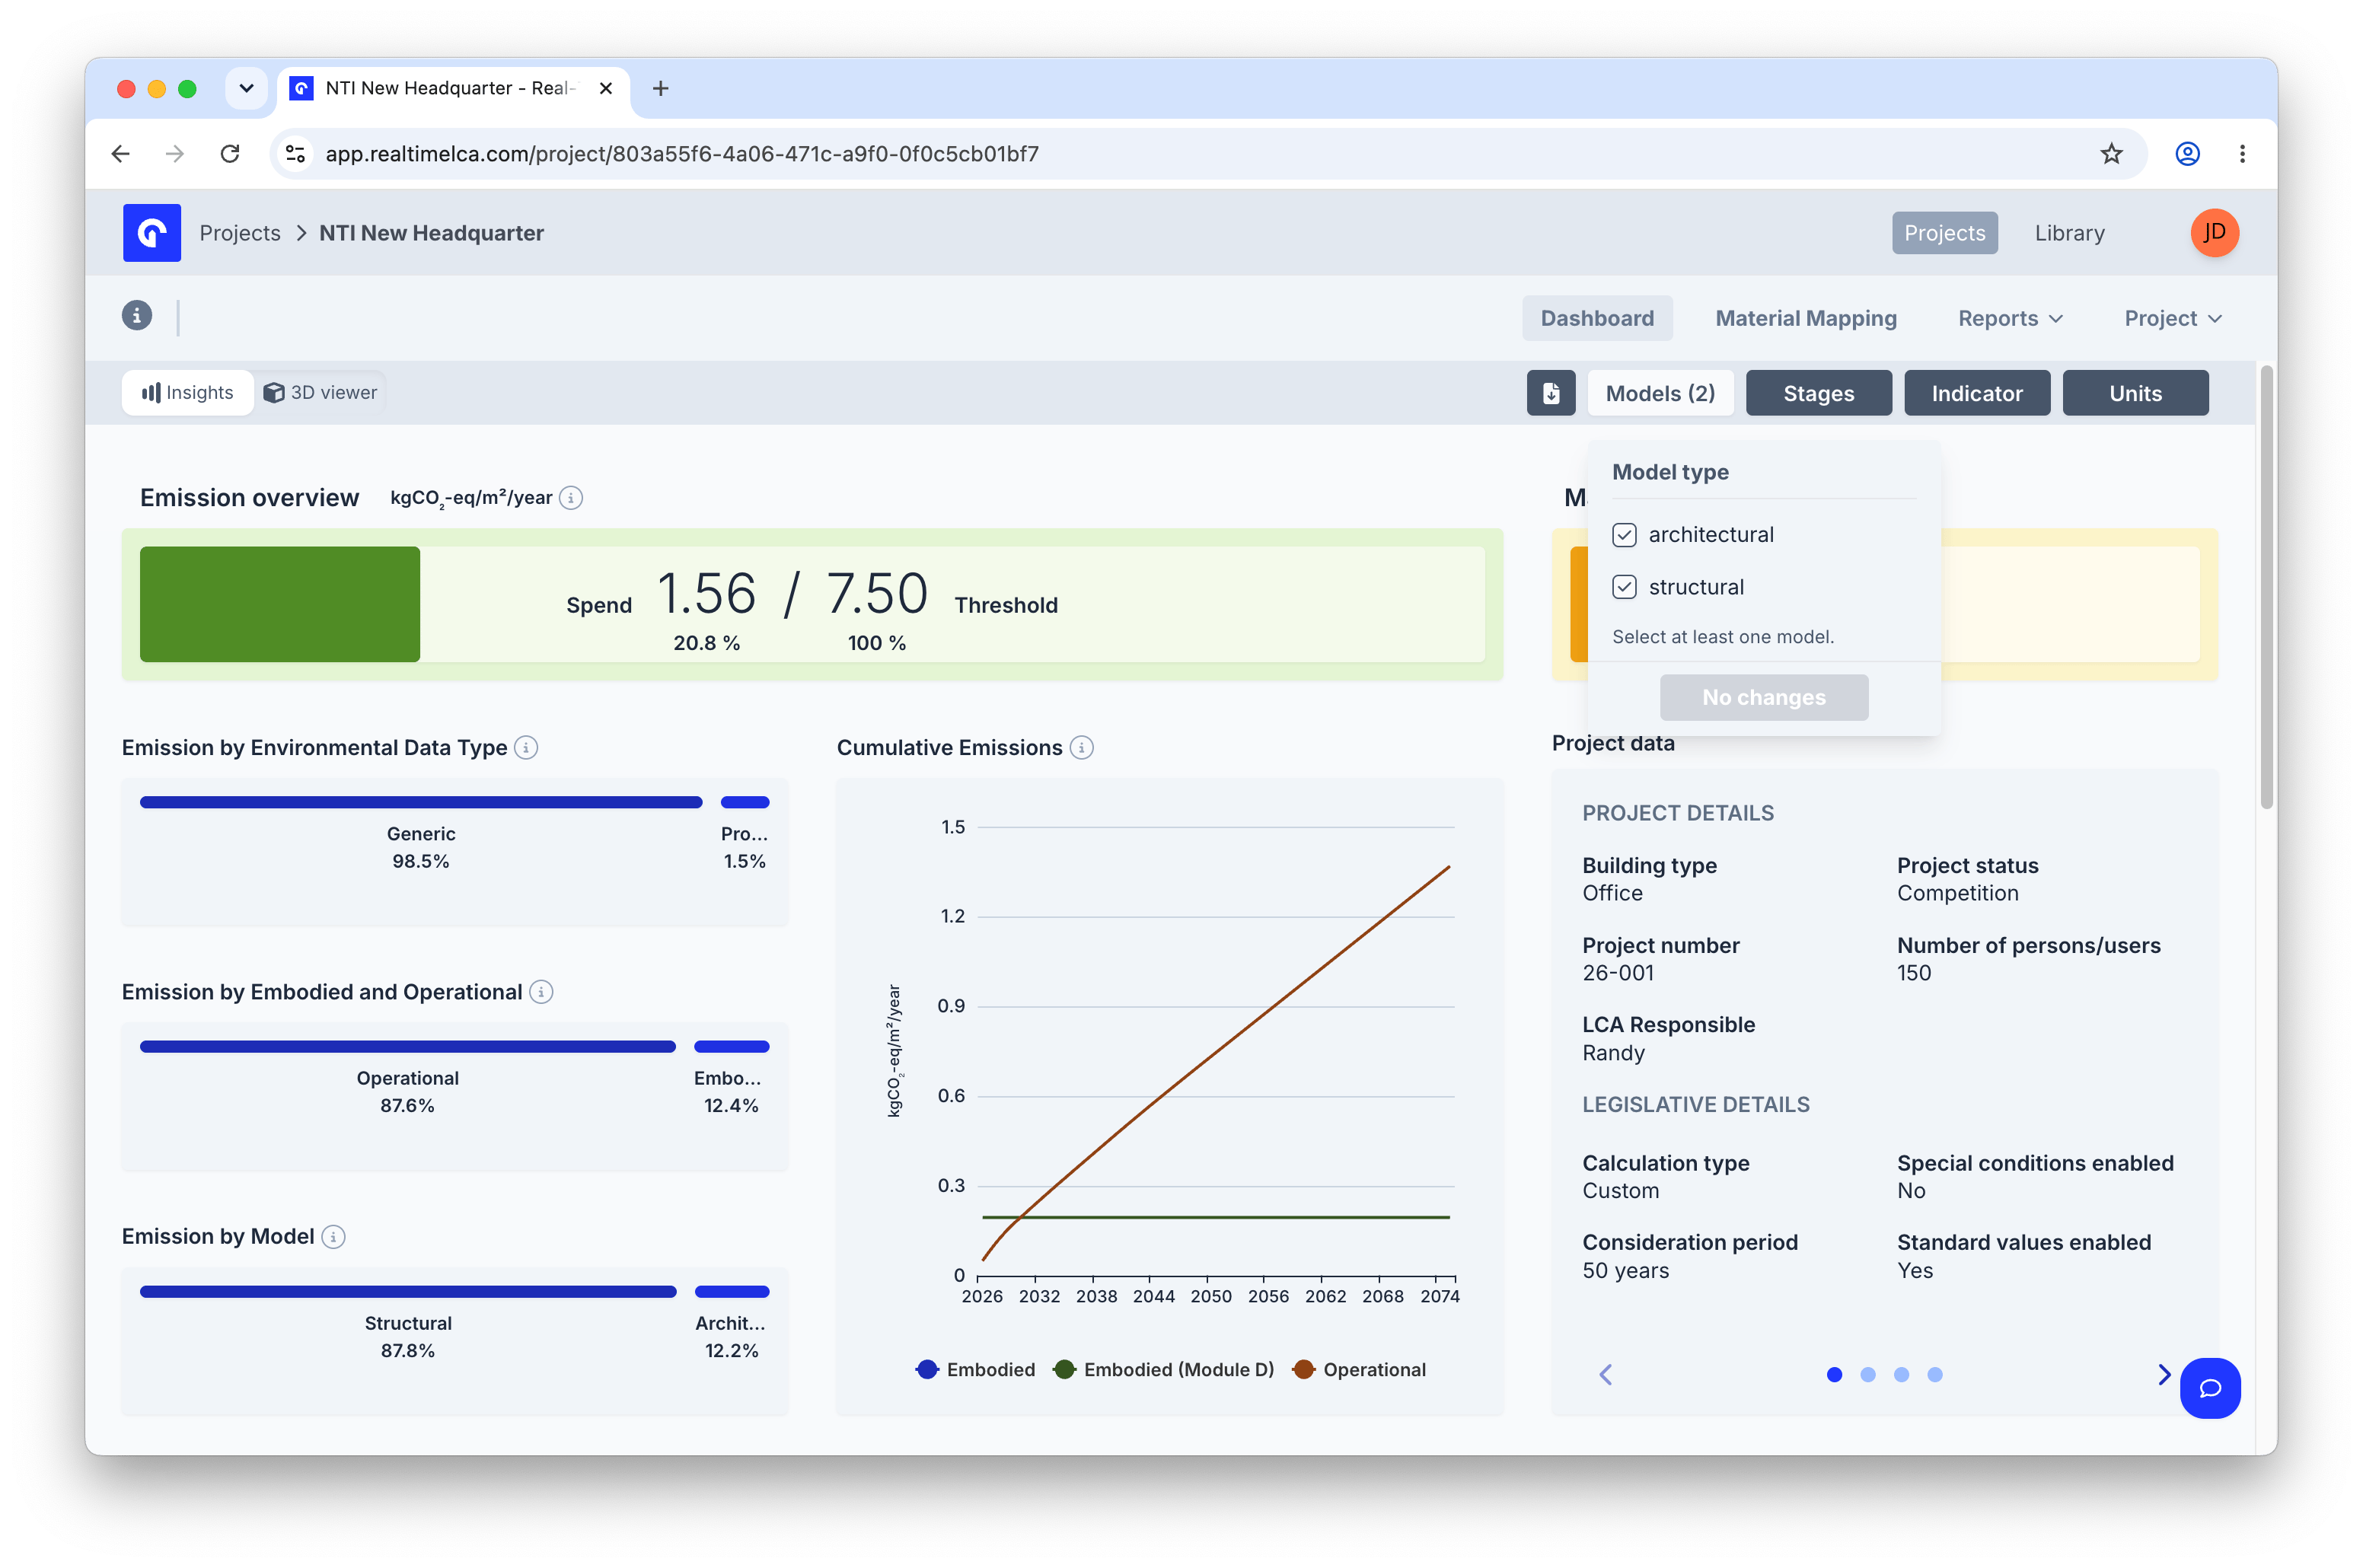
Stages filter
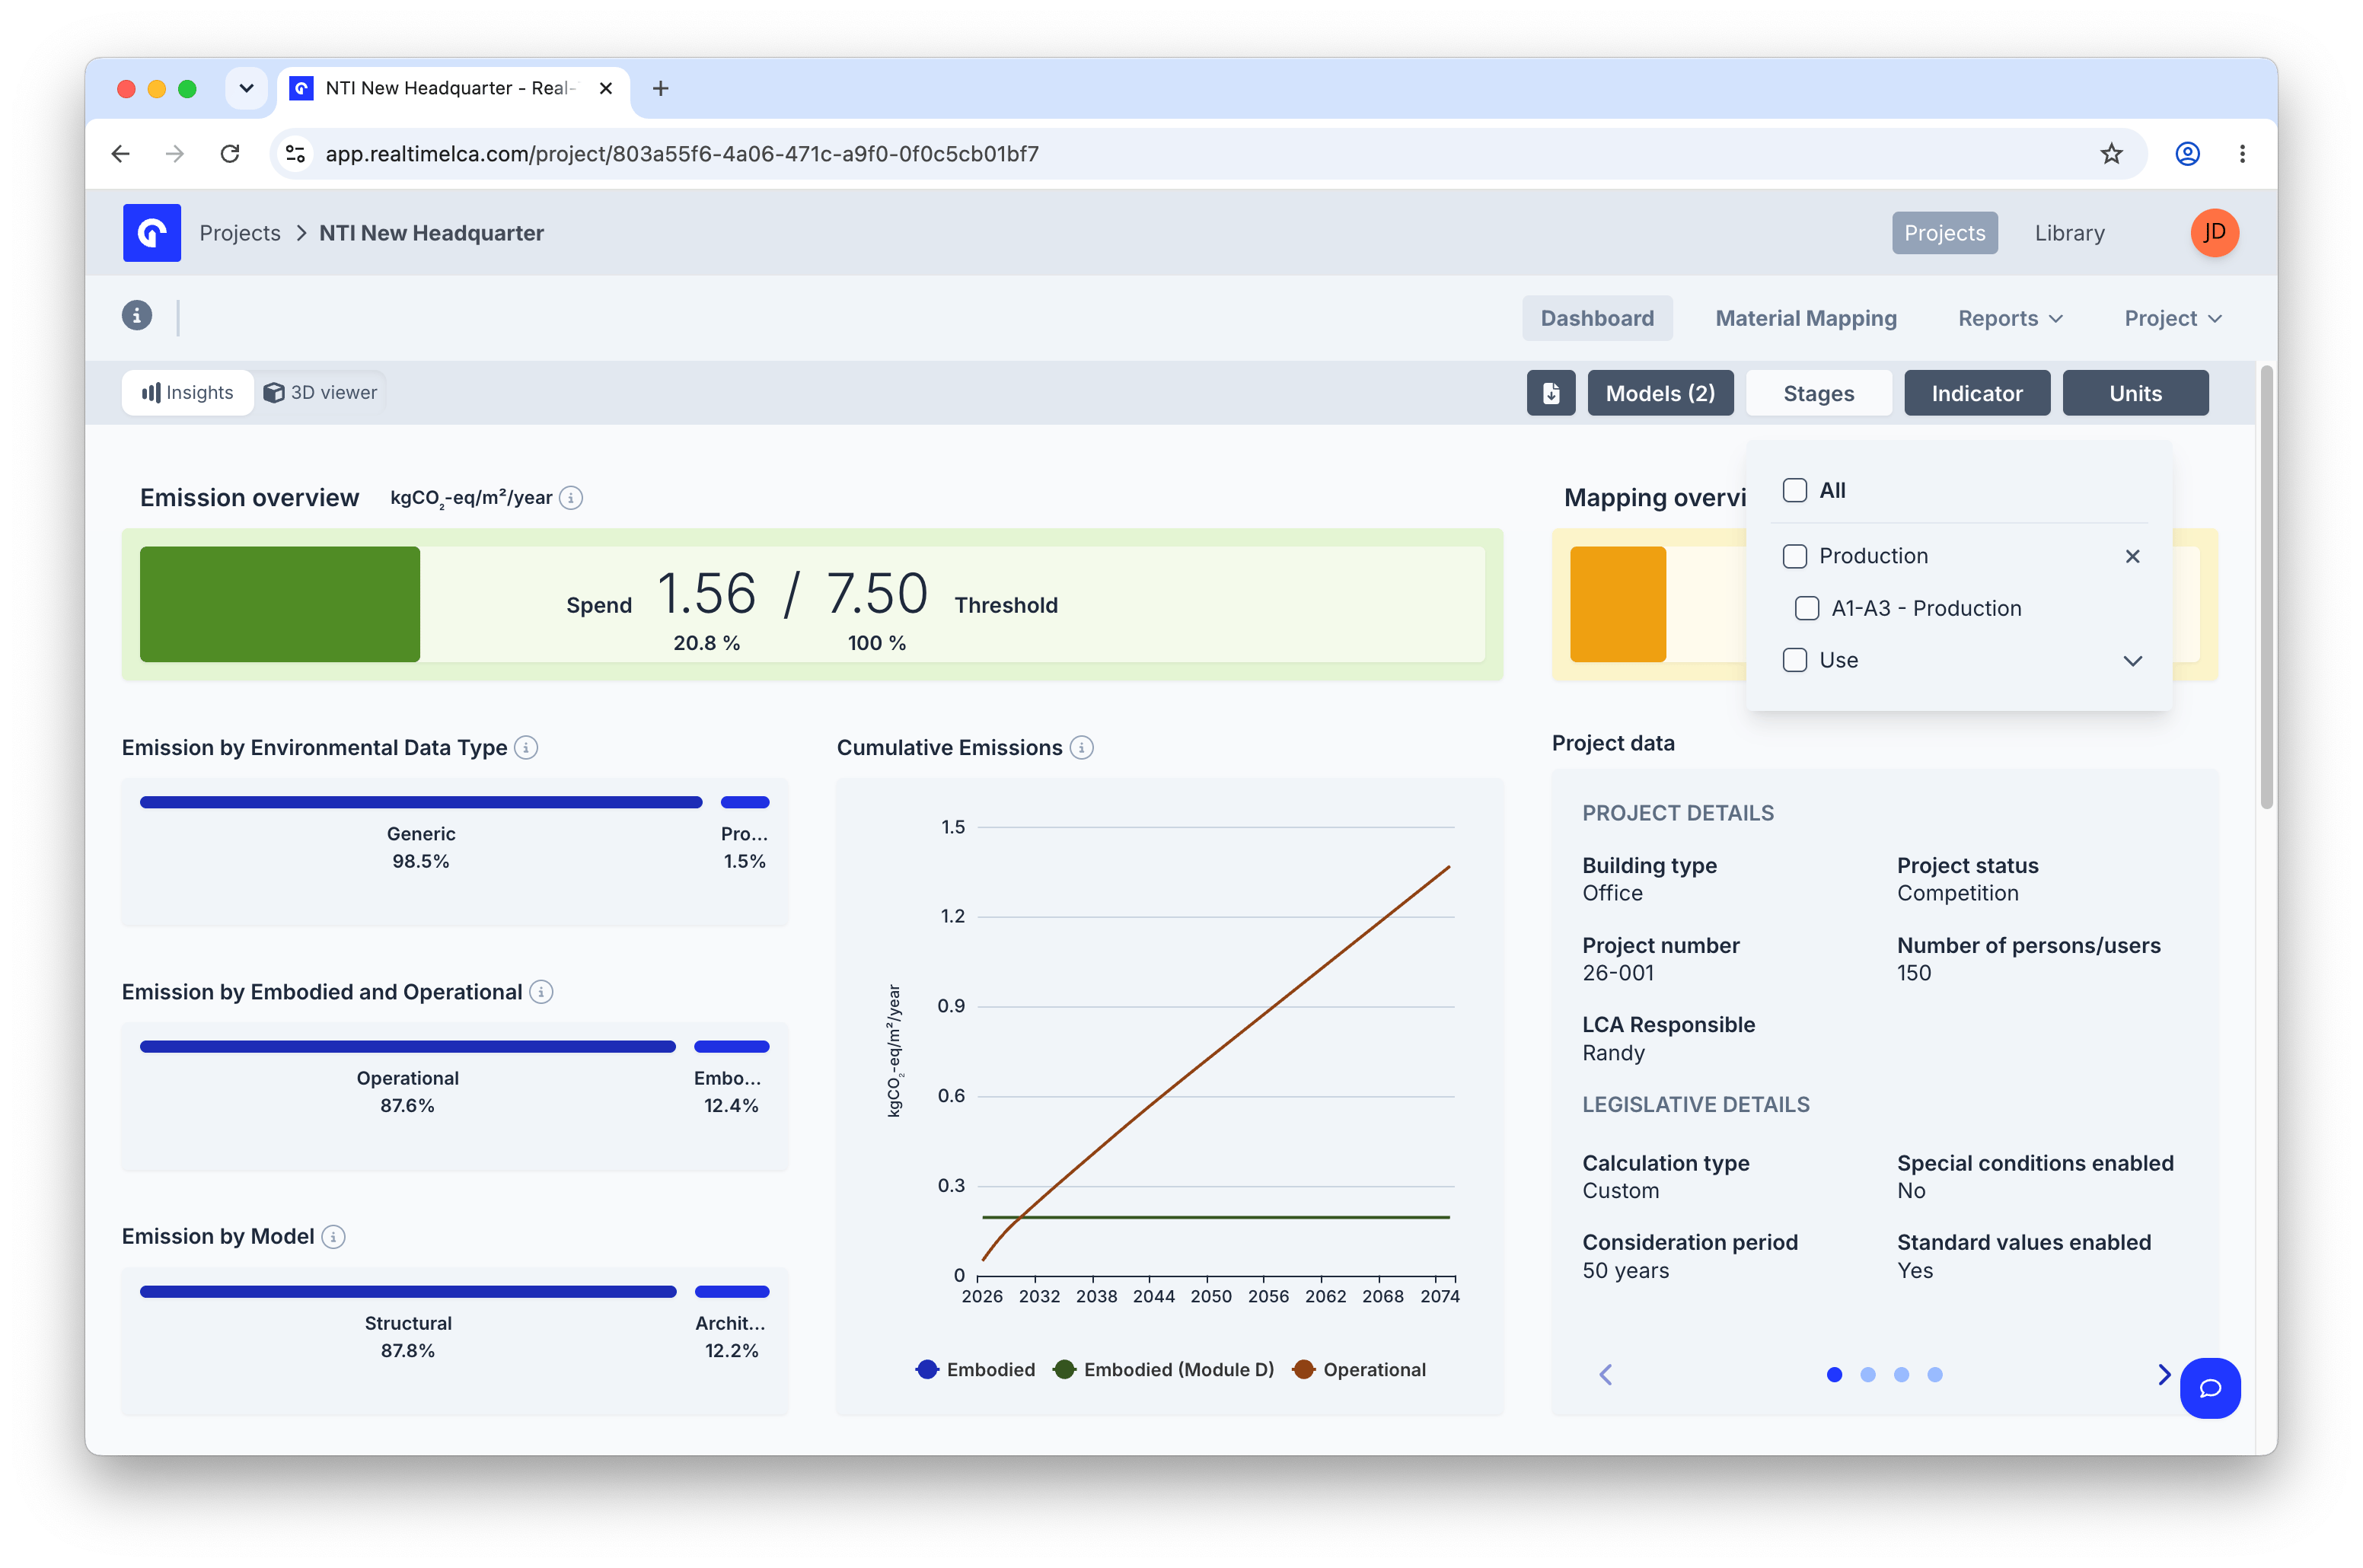
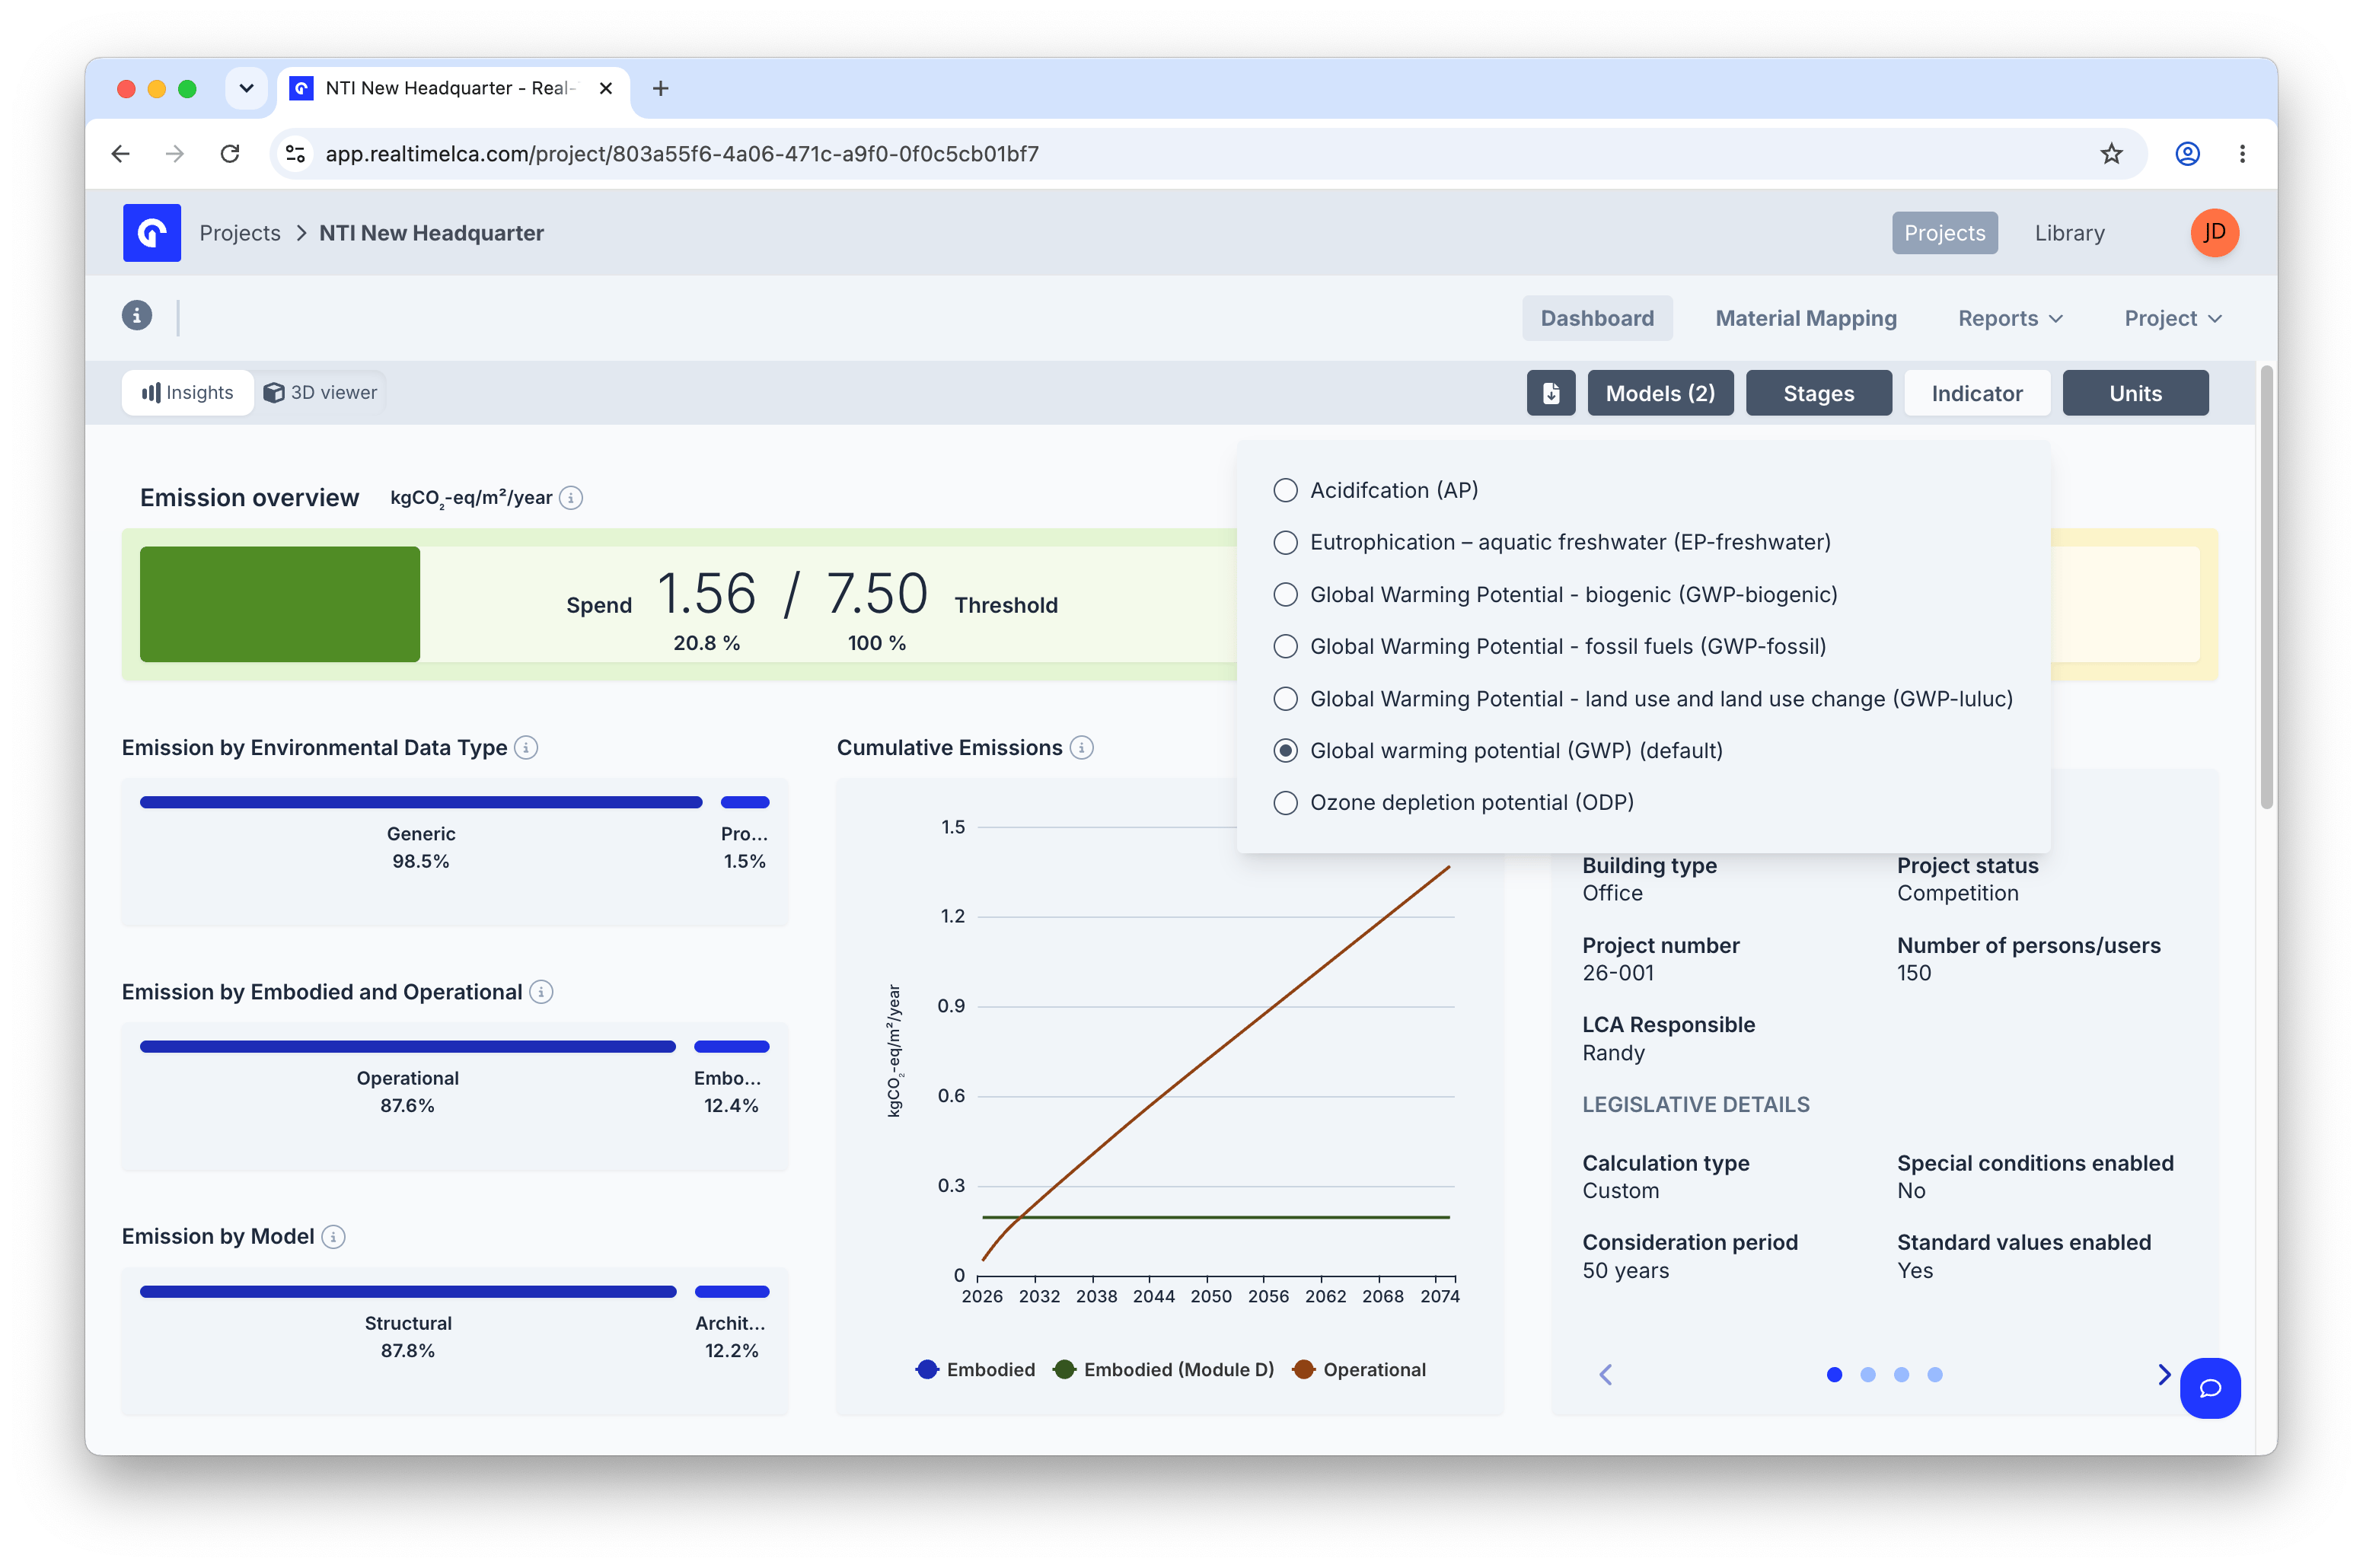
Indicator filter
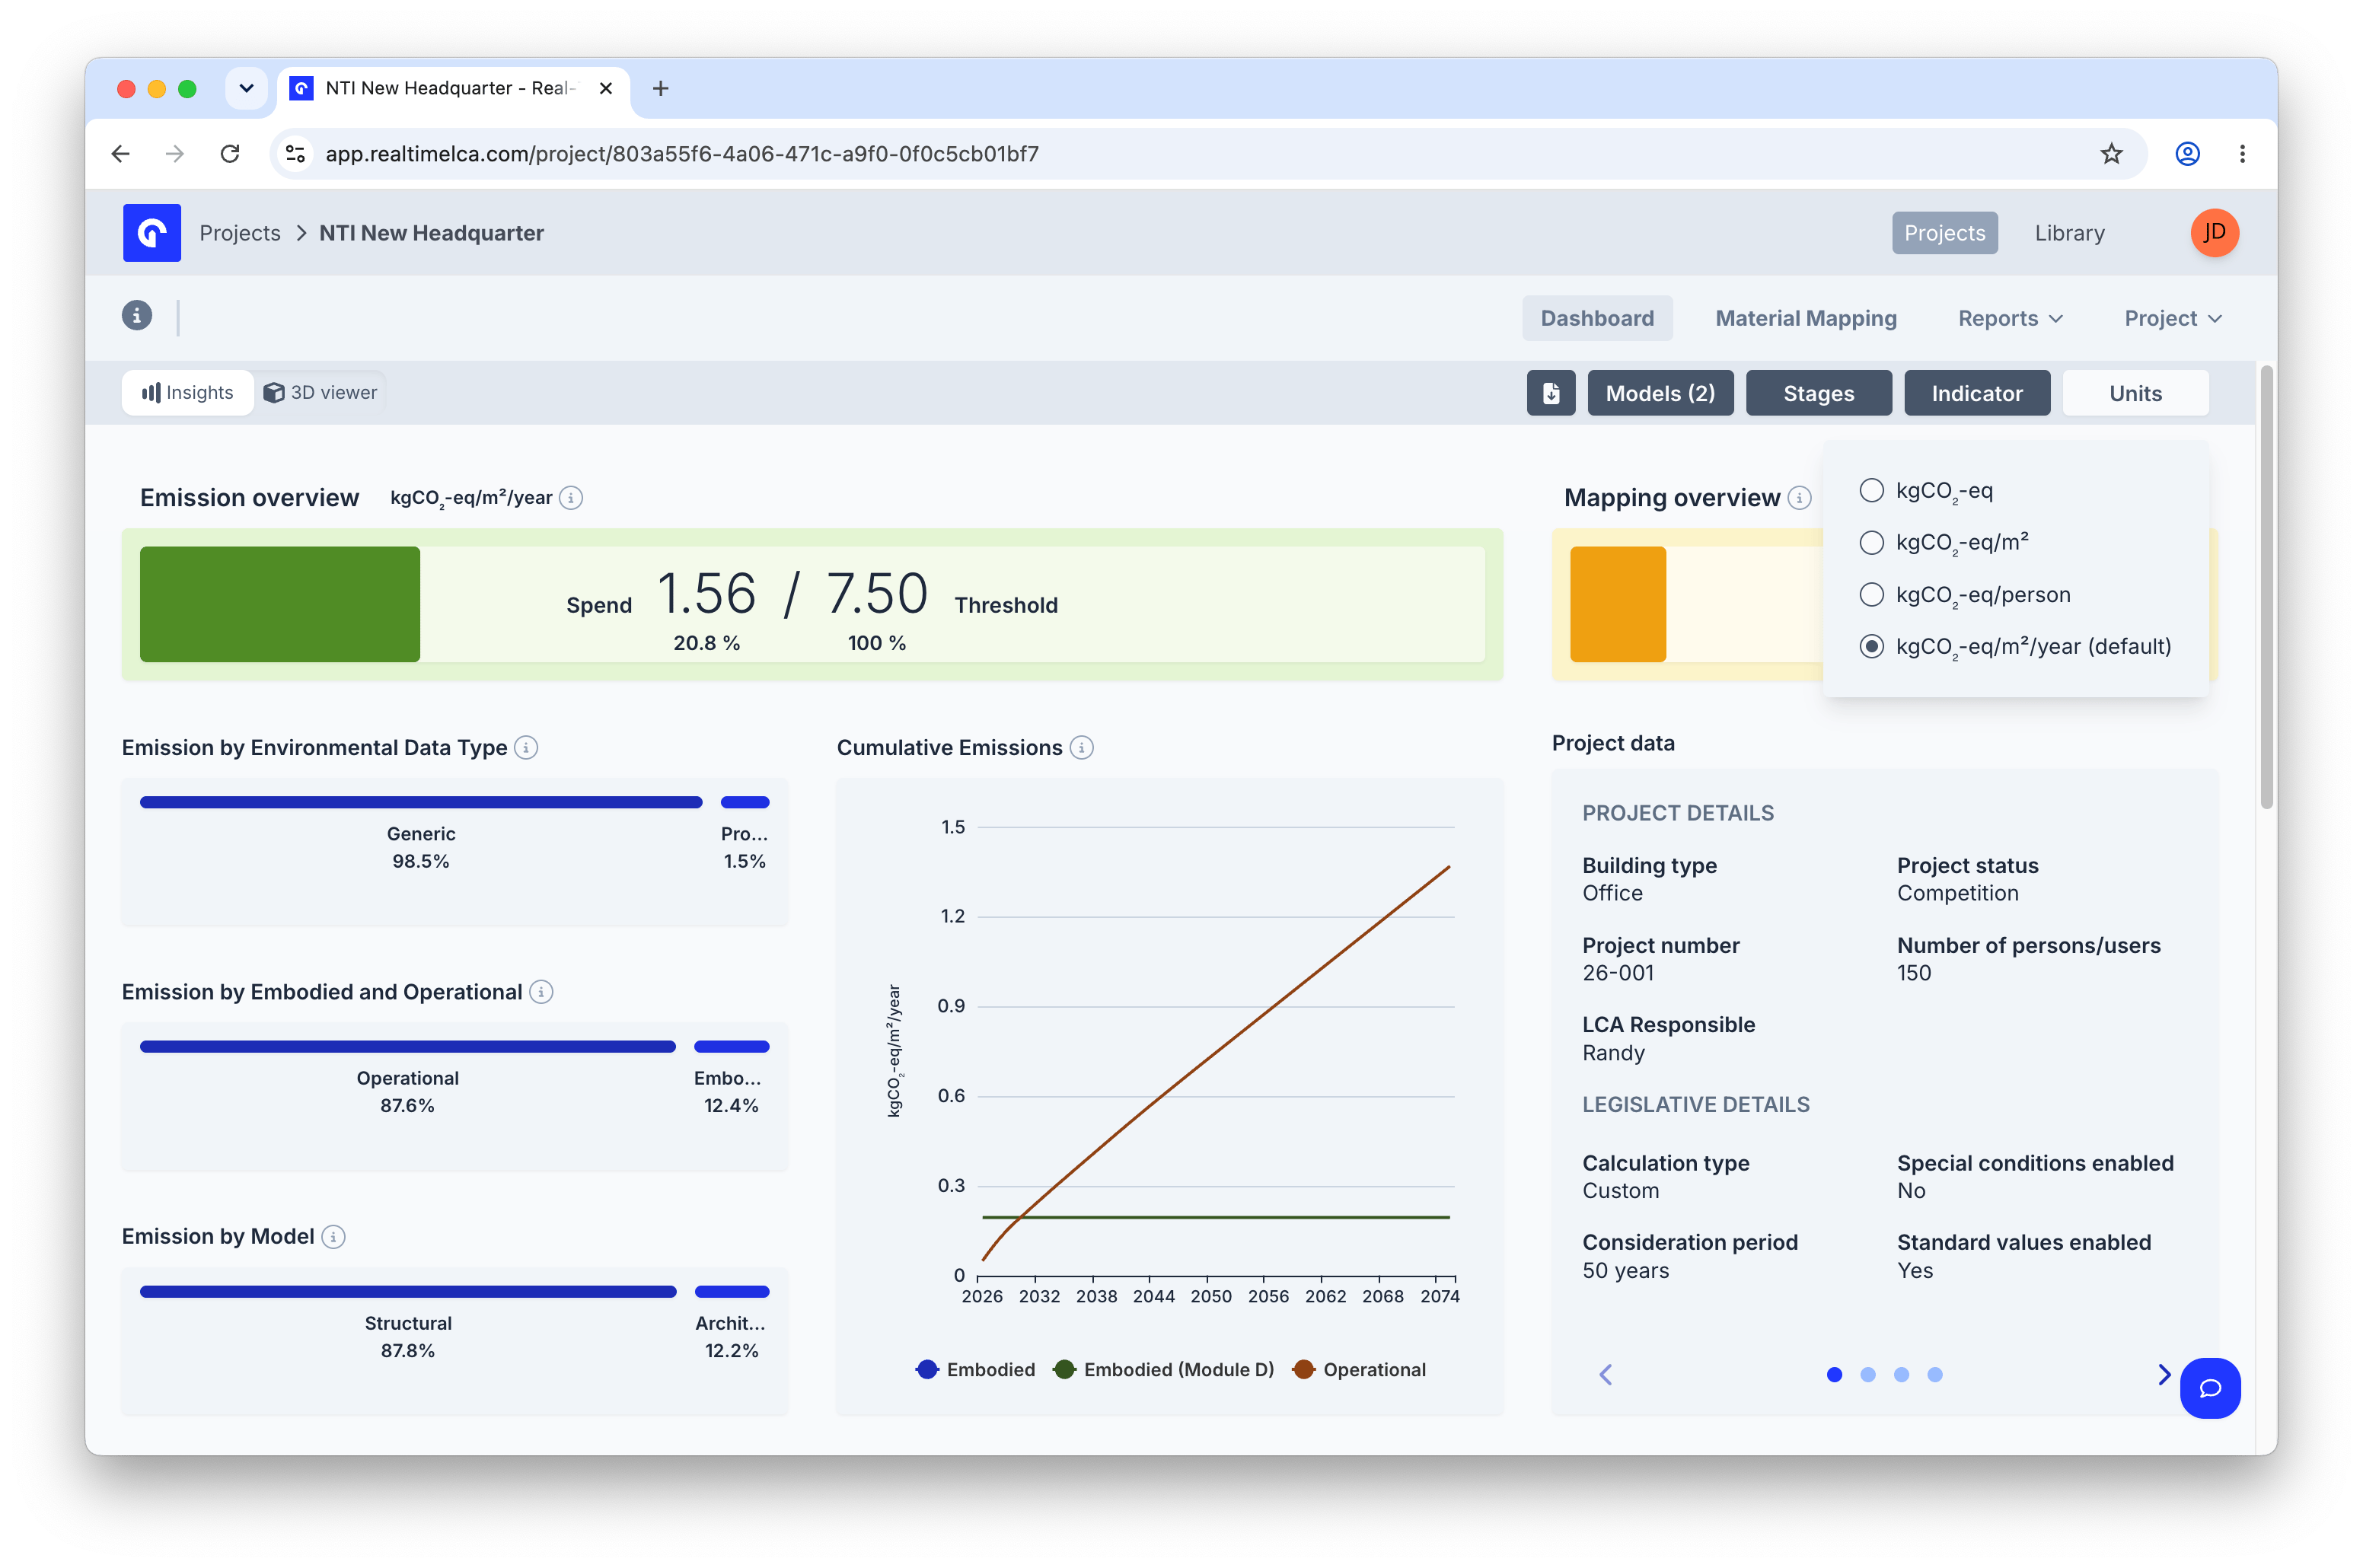
Units filter
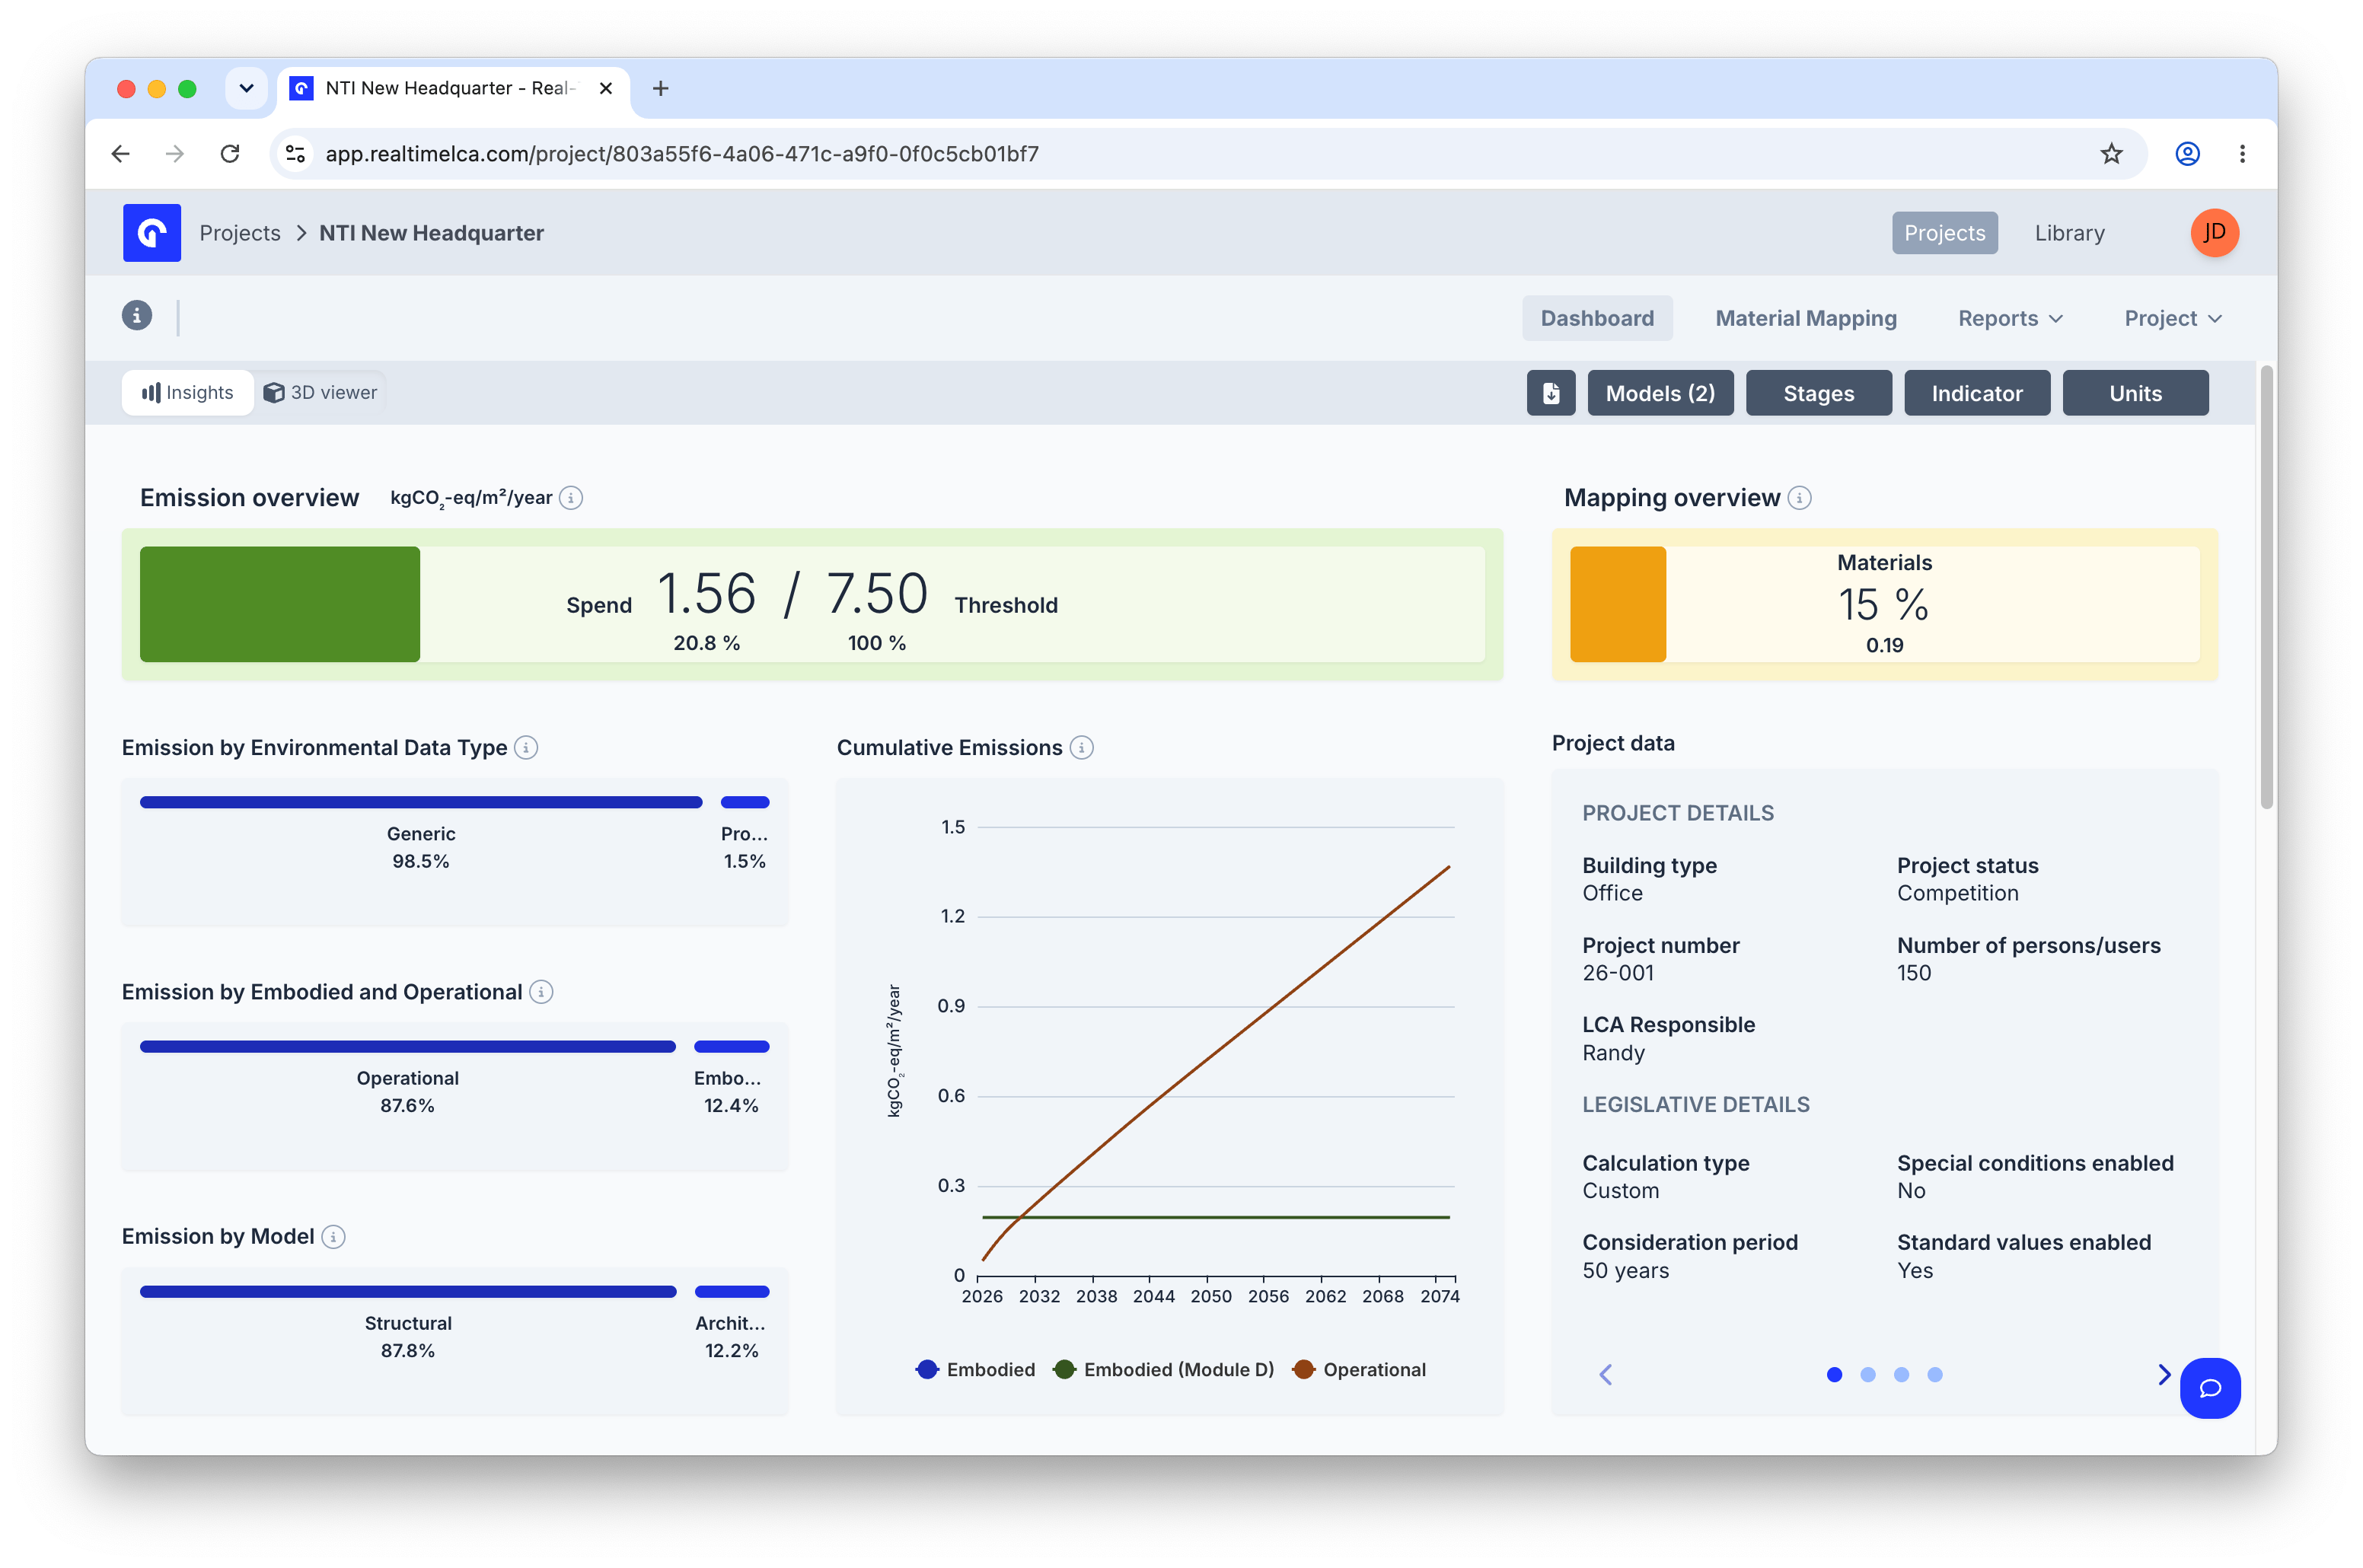
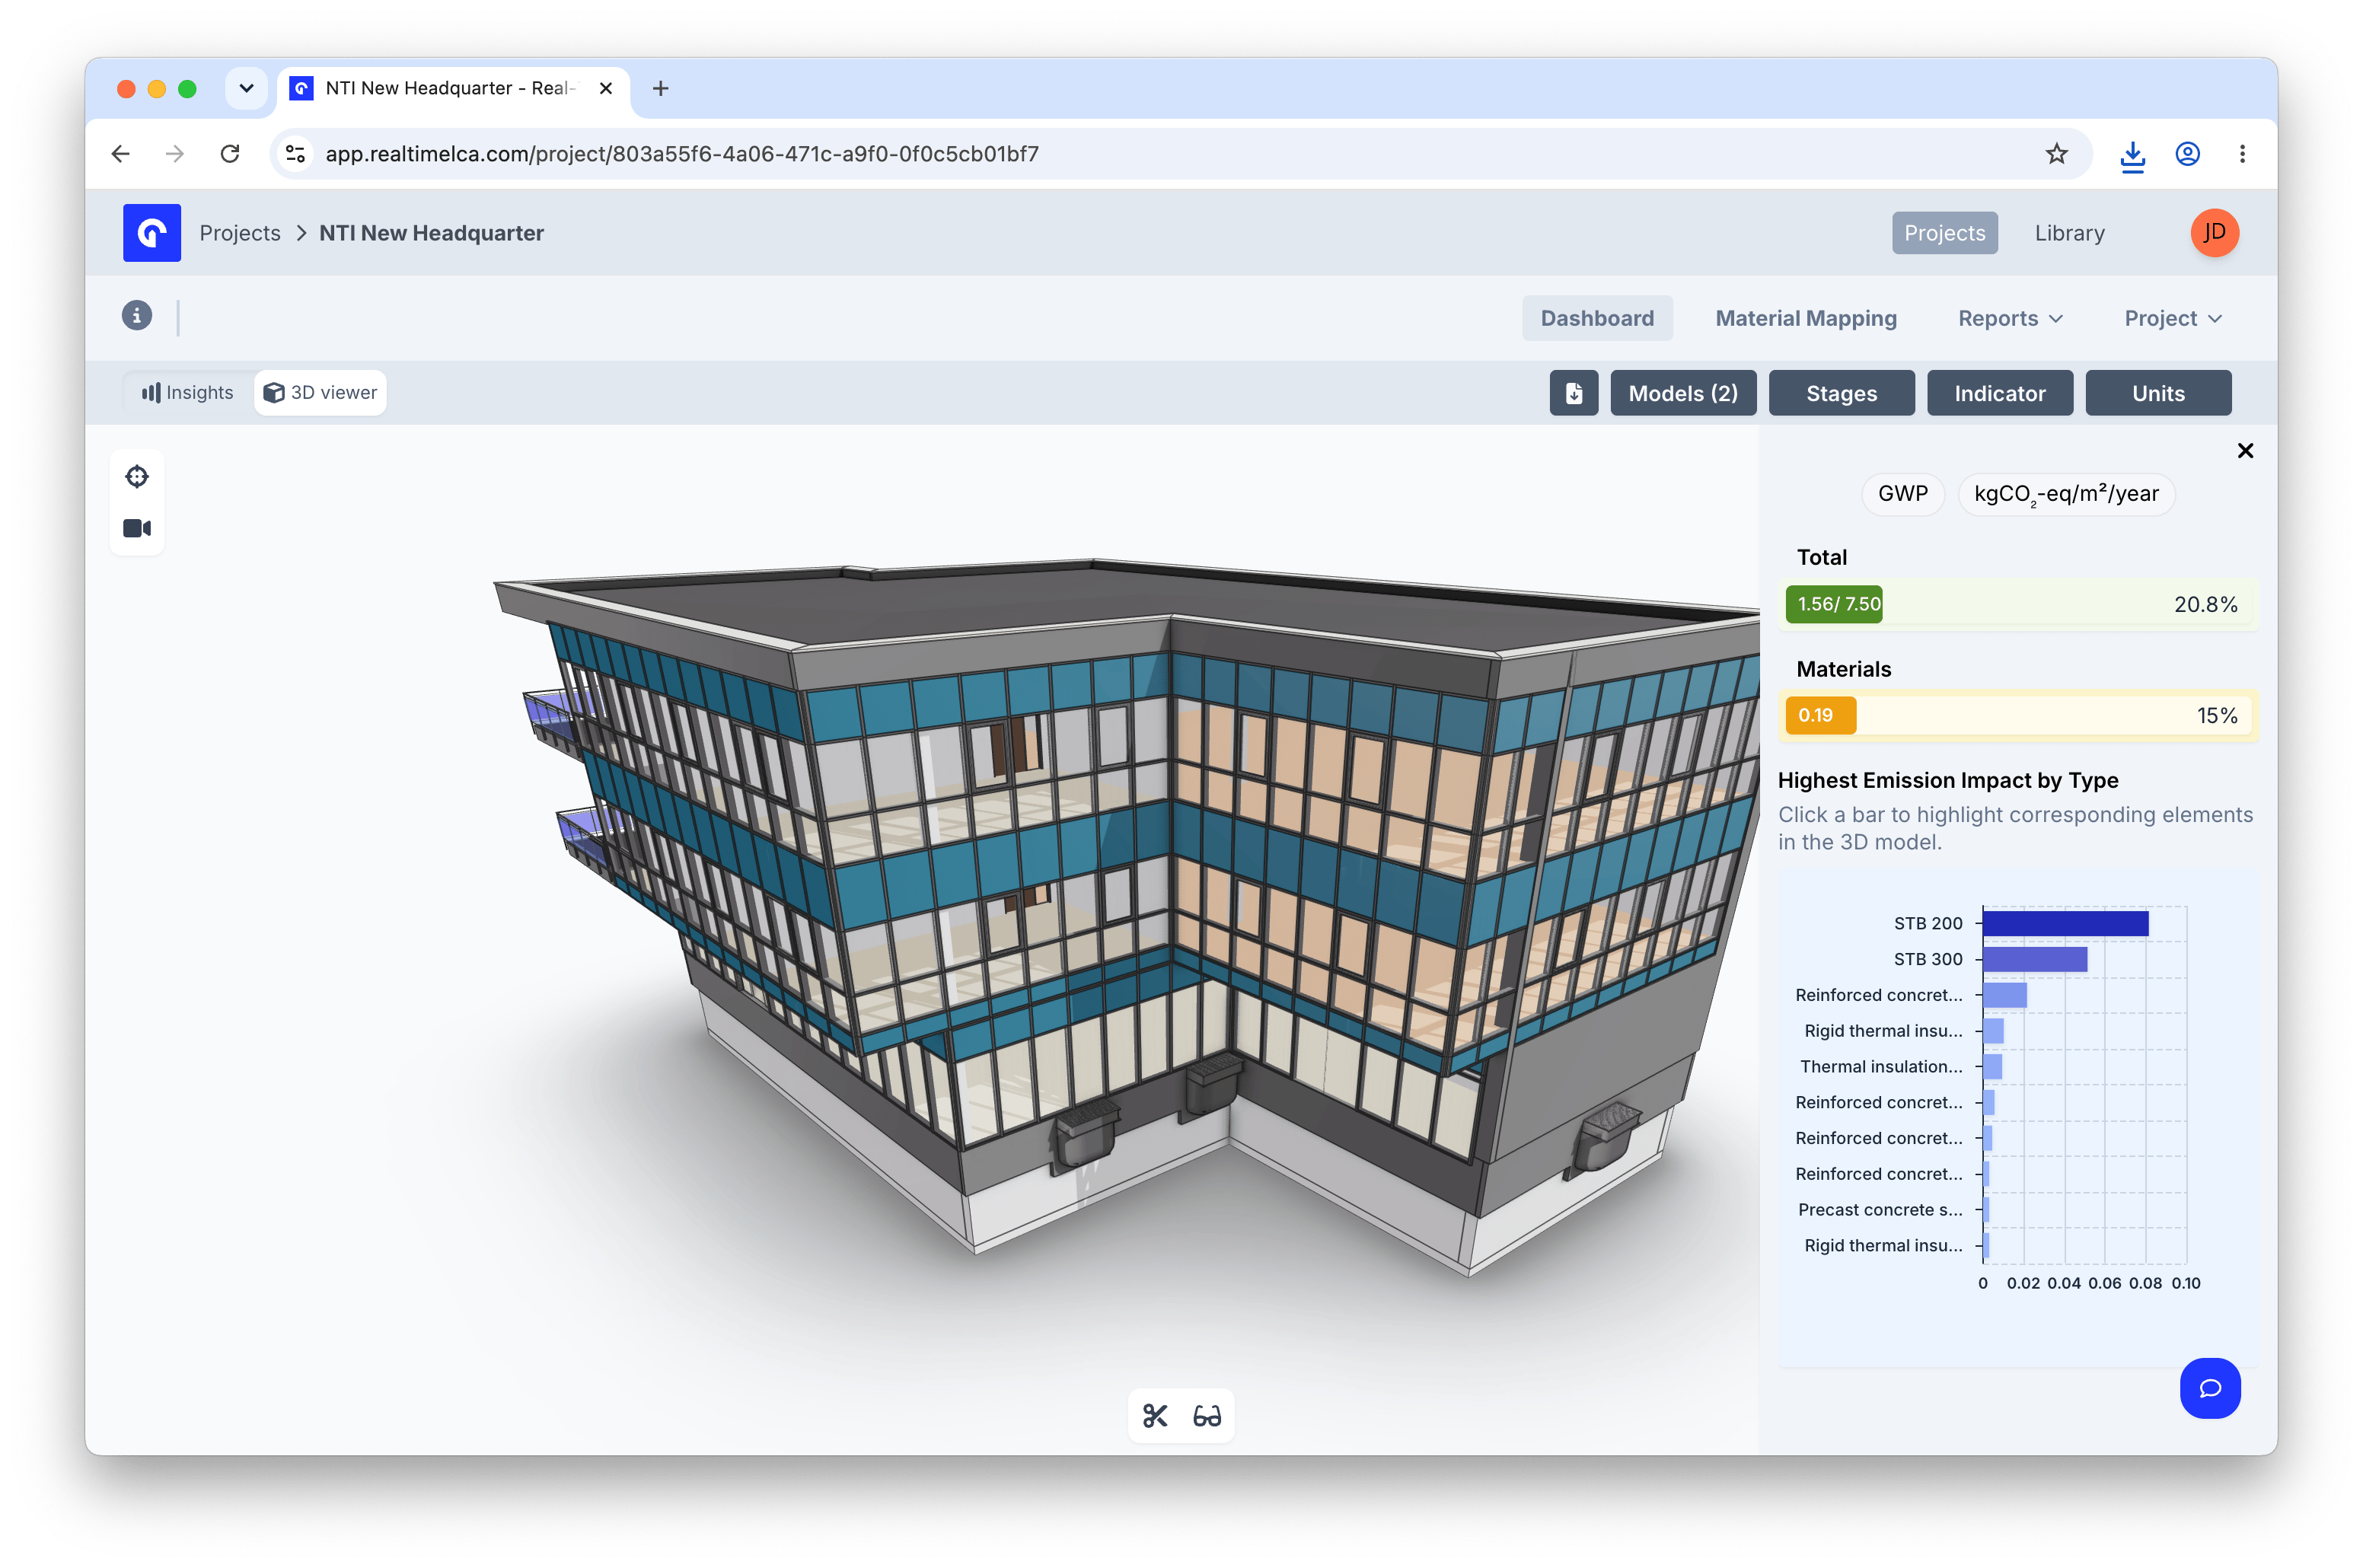
Emission overview

- 🟩 GREEN — at or below 90% of the threshold. The project is comfortably within the limit.
- 🟨 YELLOW — above 90% and up to 95% of the threshold. The project is close to exceeding the limit.
- 🟥 RED — above 95% of the threshold. The project is at or beyond the limit and needs attention.
Mapping overview

Emission impact charts
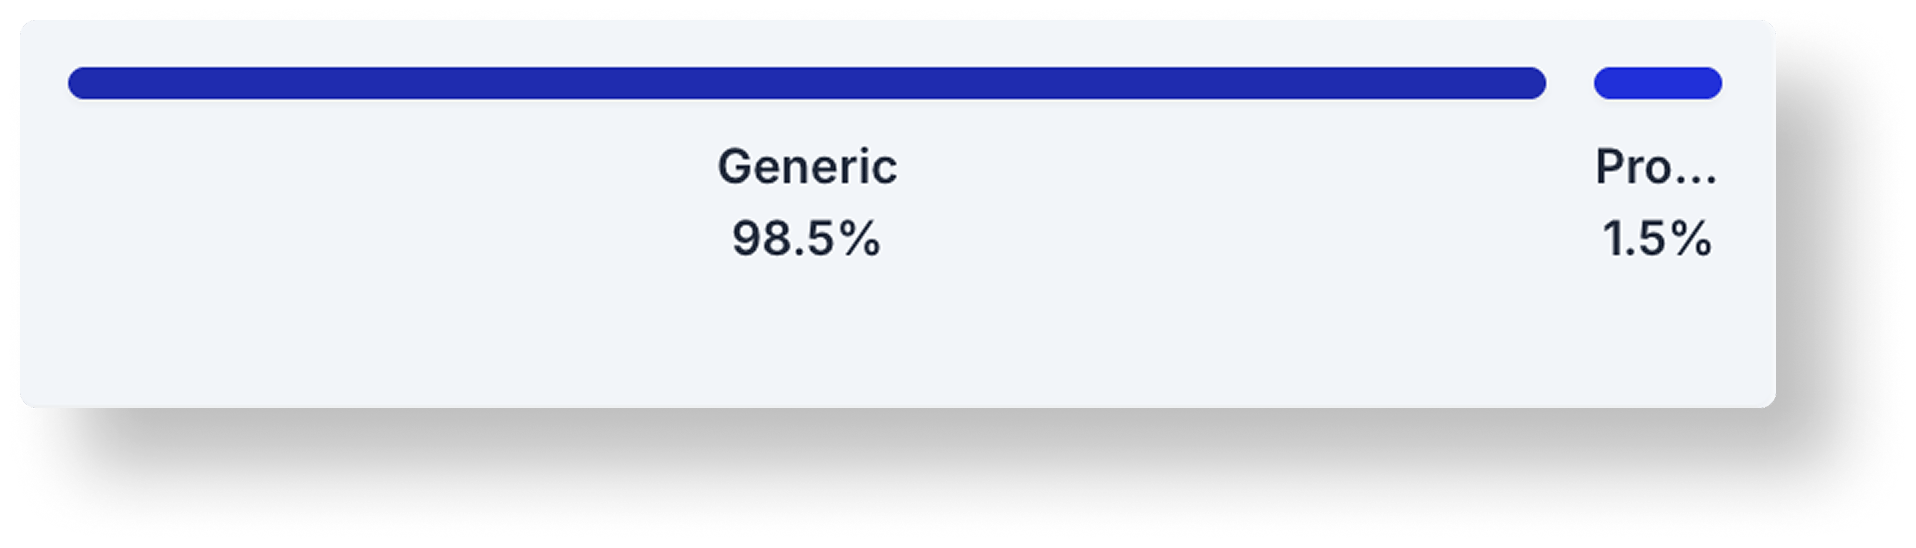
The middle of the Insights view holds the emission breakdown charts. The selected Indicator, Stages, Models, and Units filters apply to all of them.Emission by Environmental Data Type
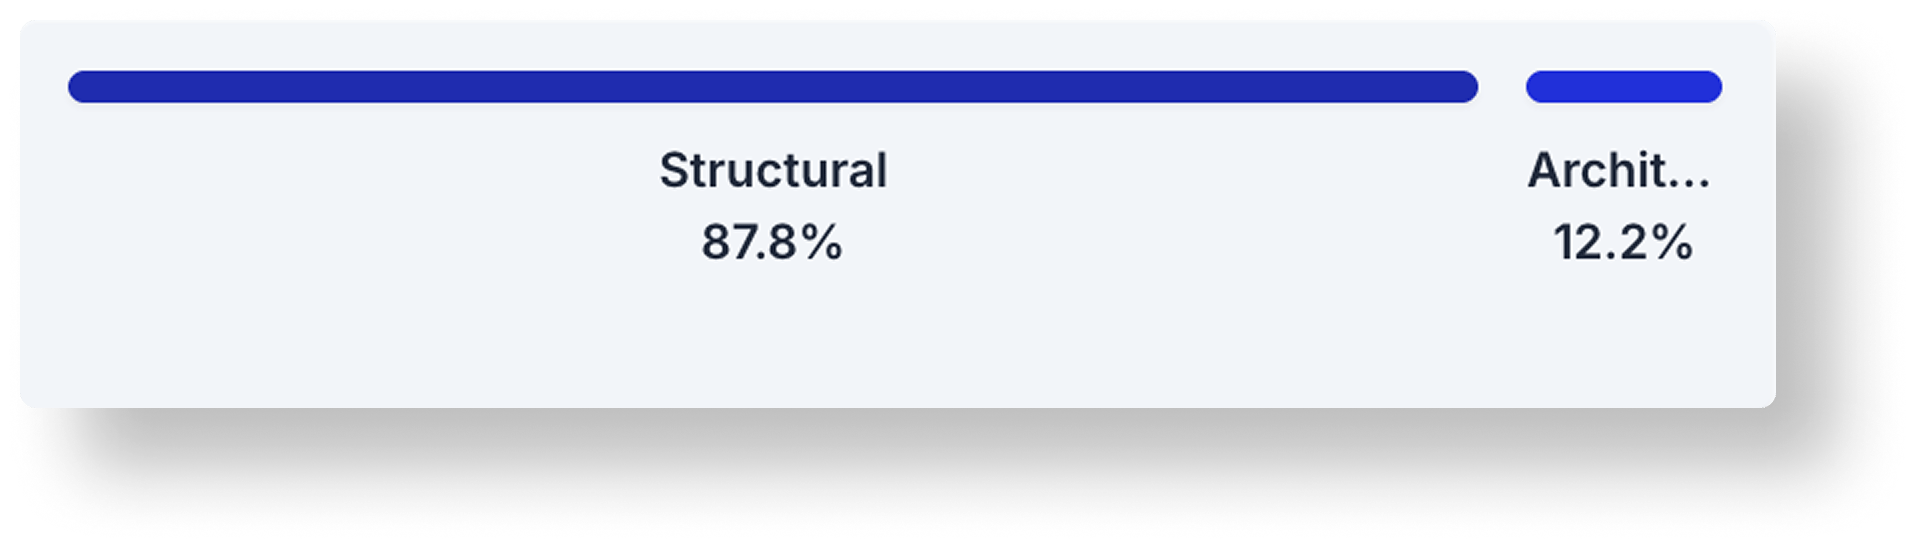
Emission by Embodied and Operational

Emission by Model
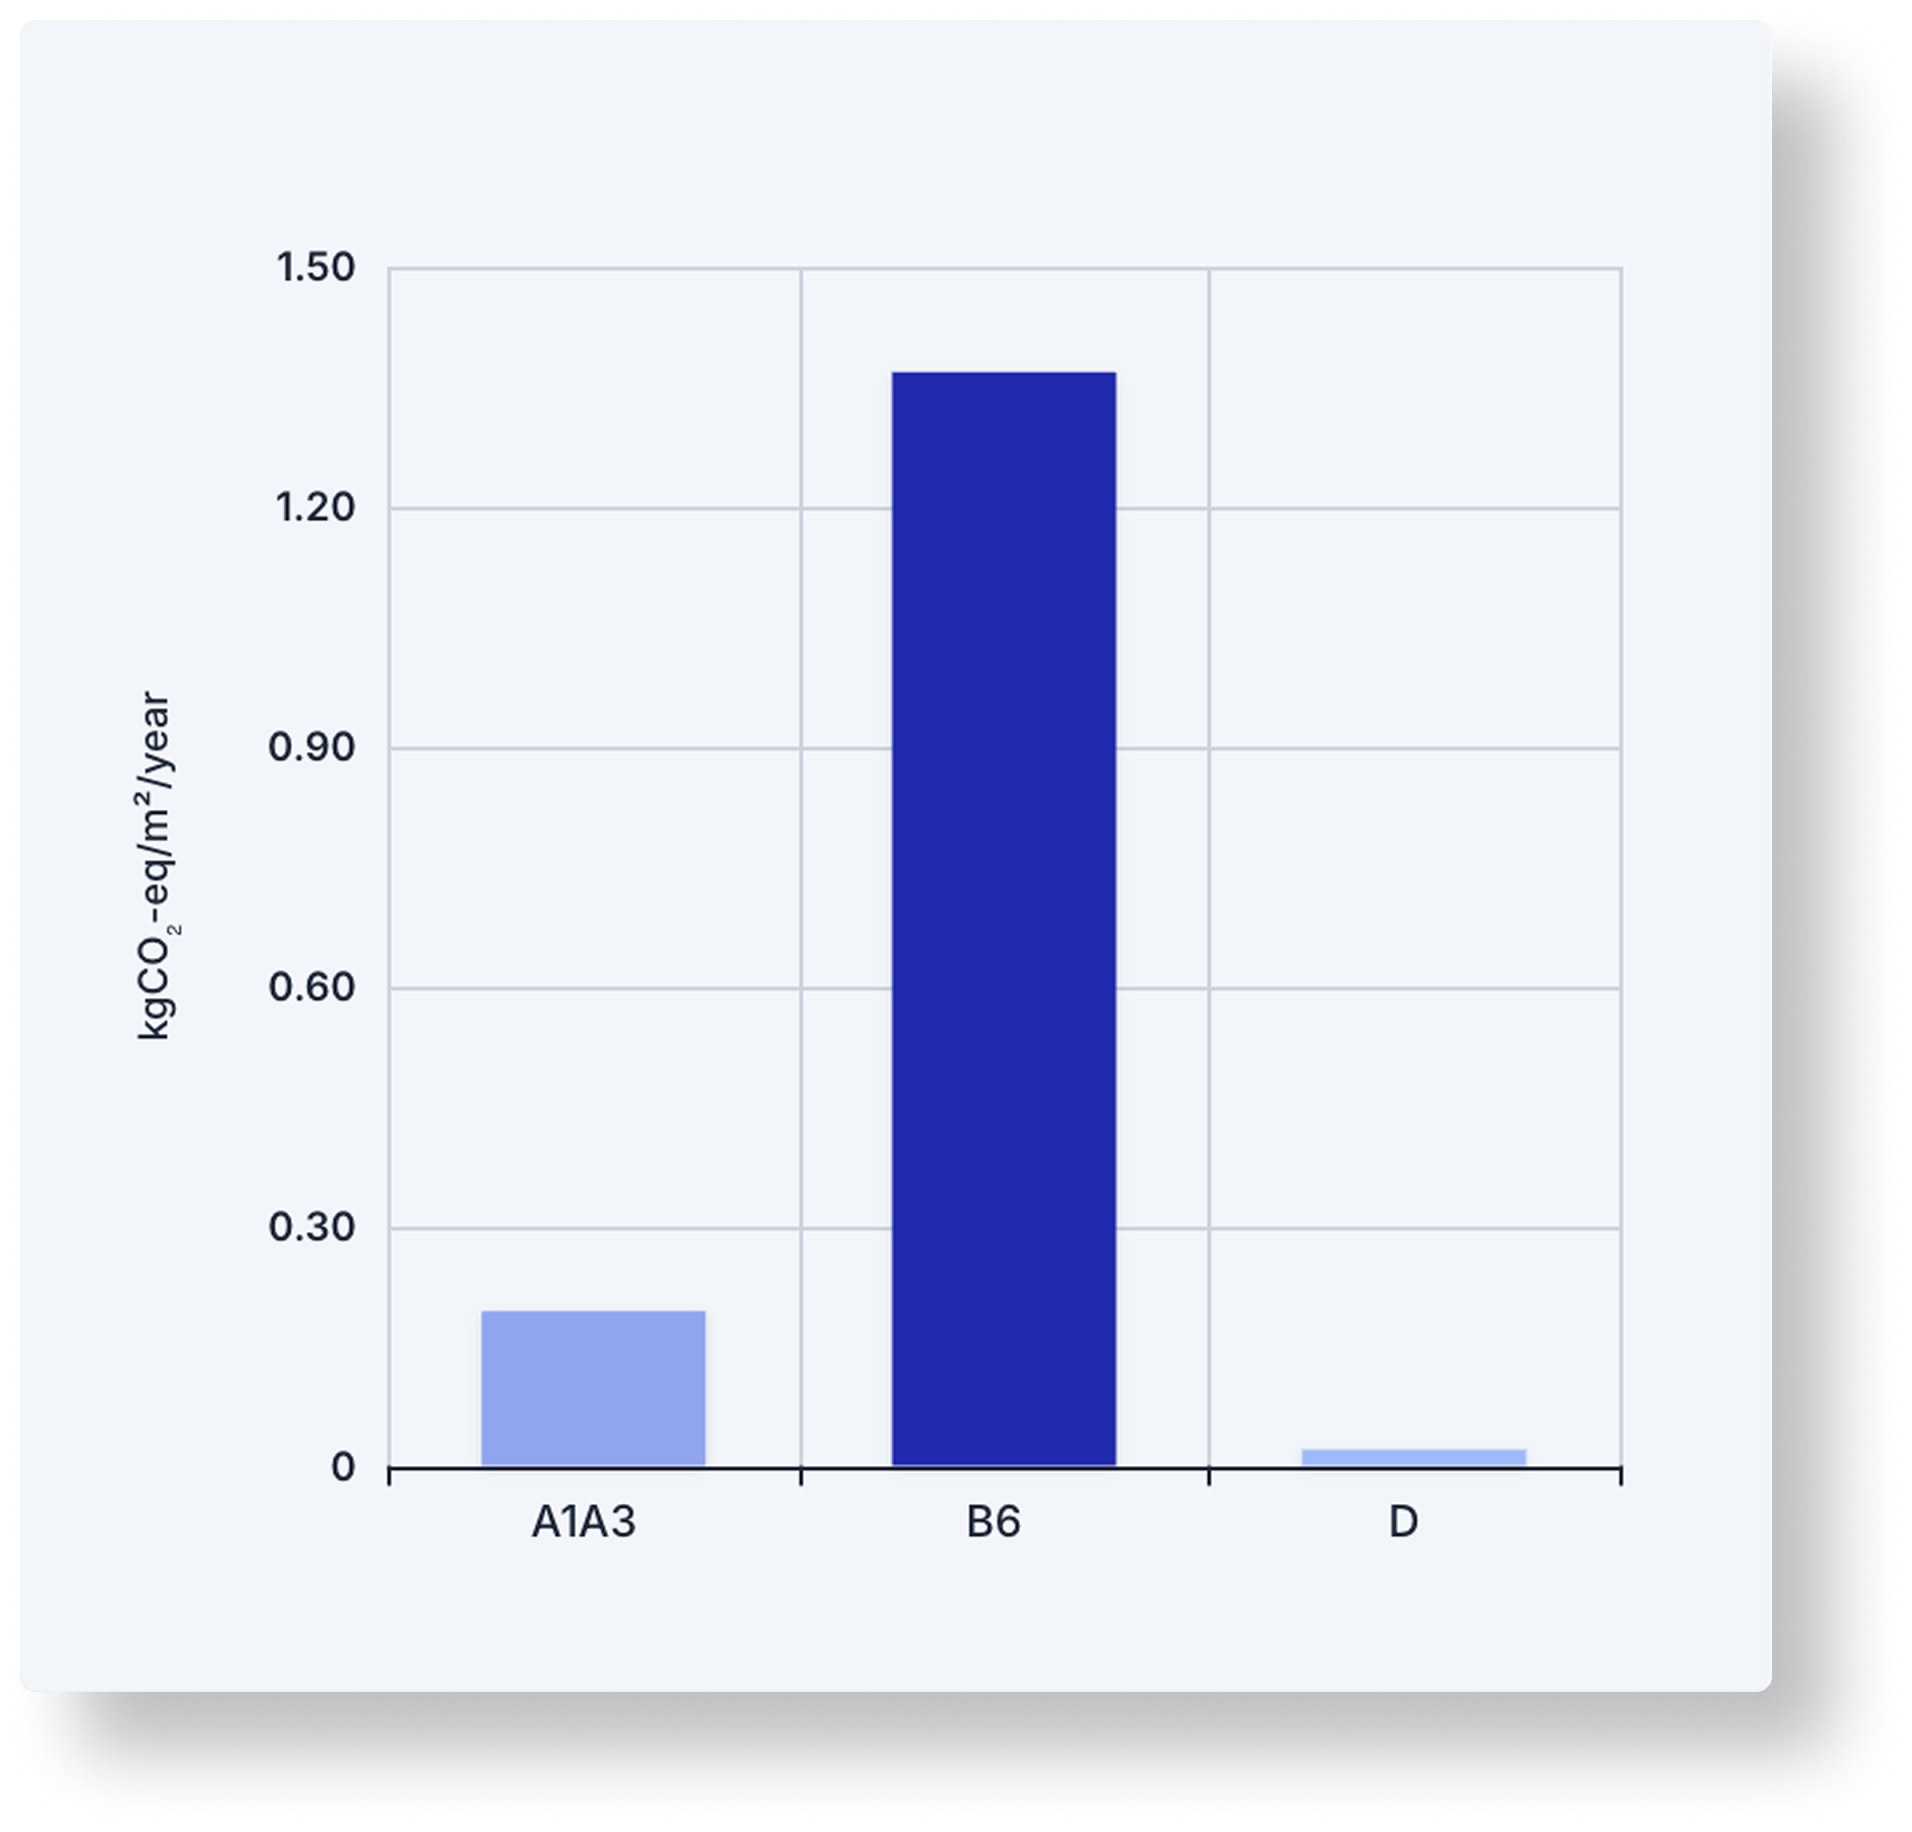
Emission by Material Lifecycle Stage
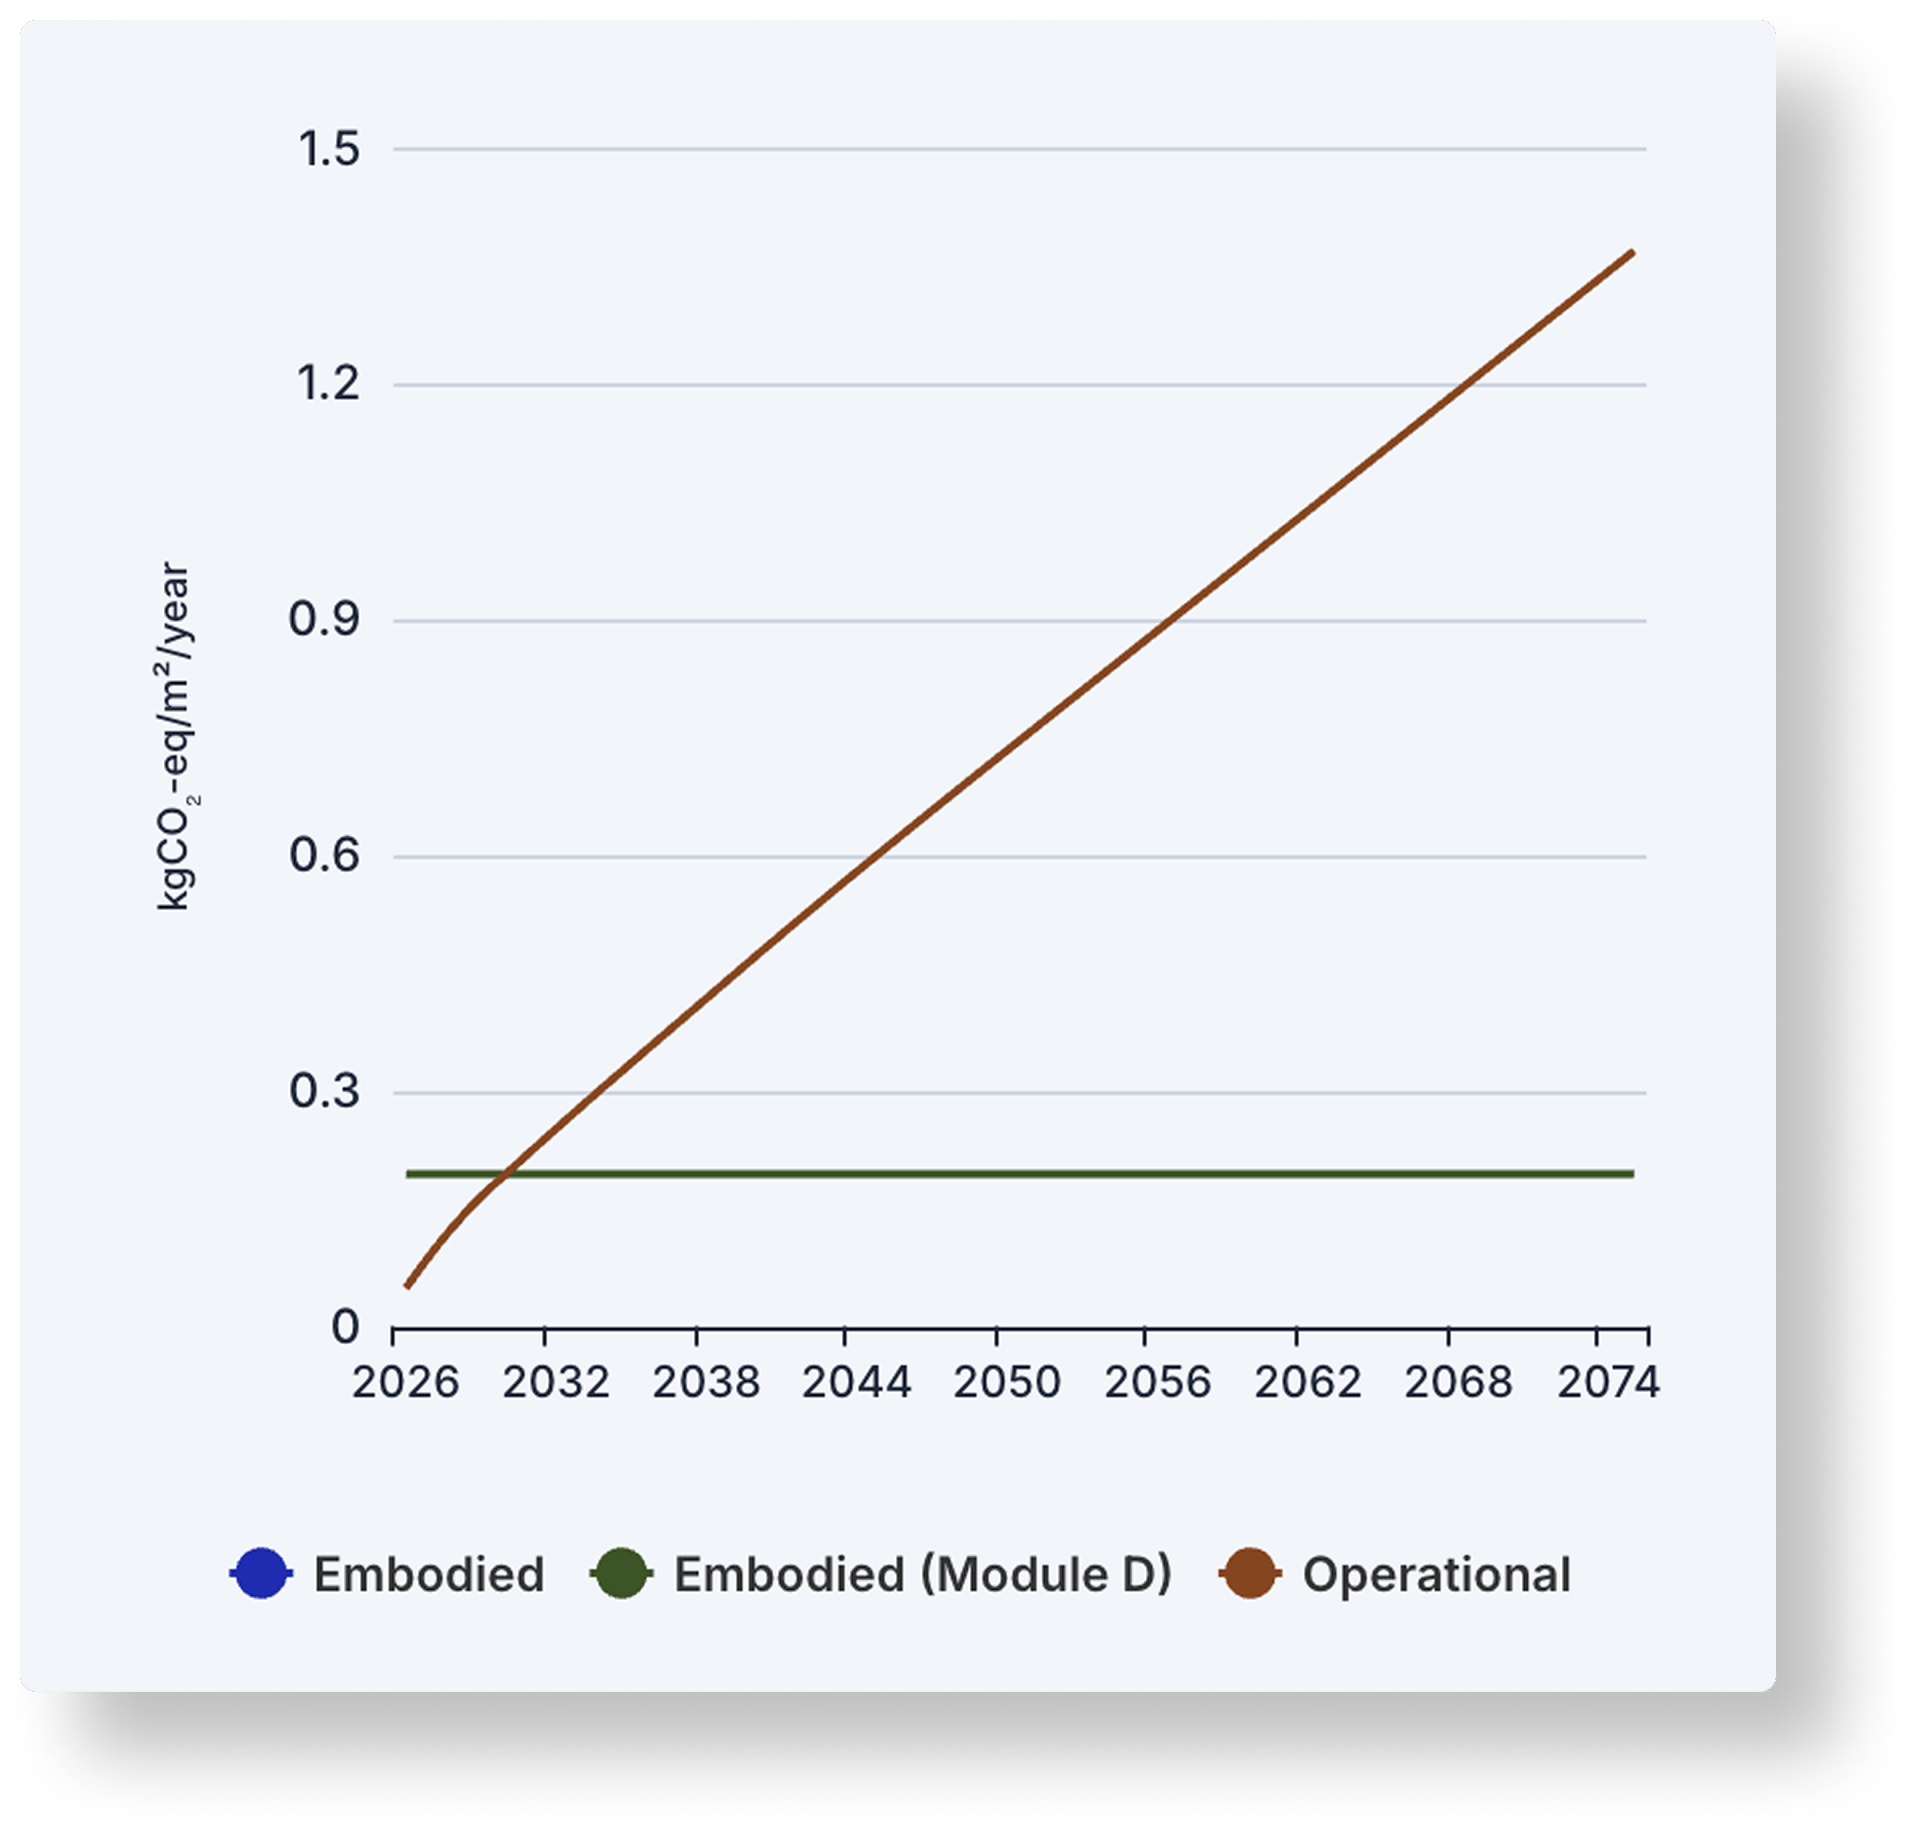
Cumulative Emissions
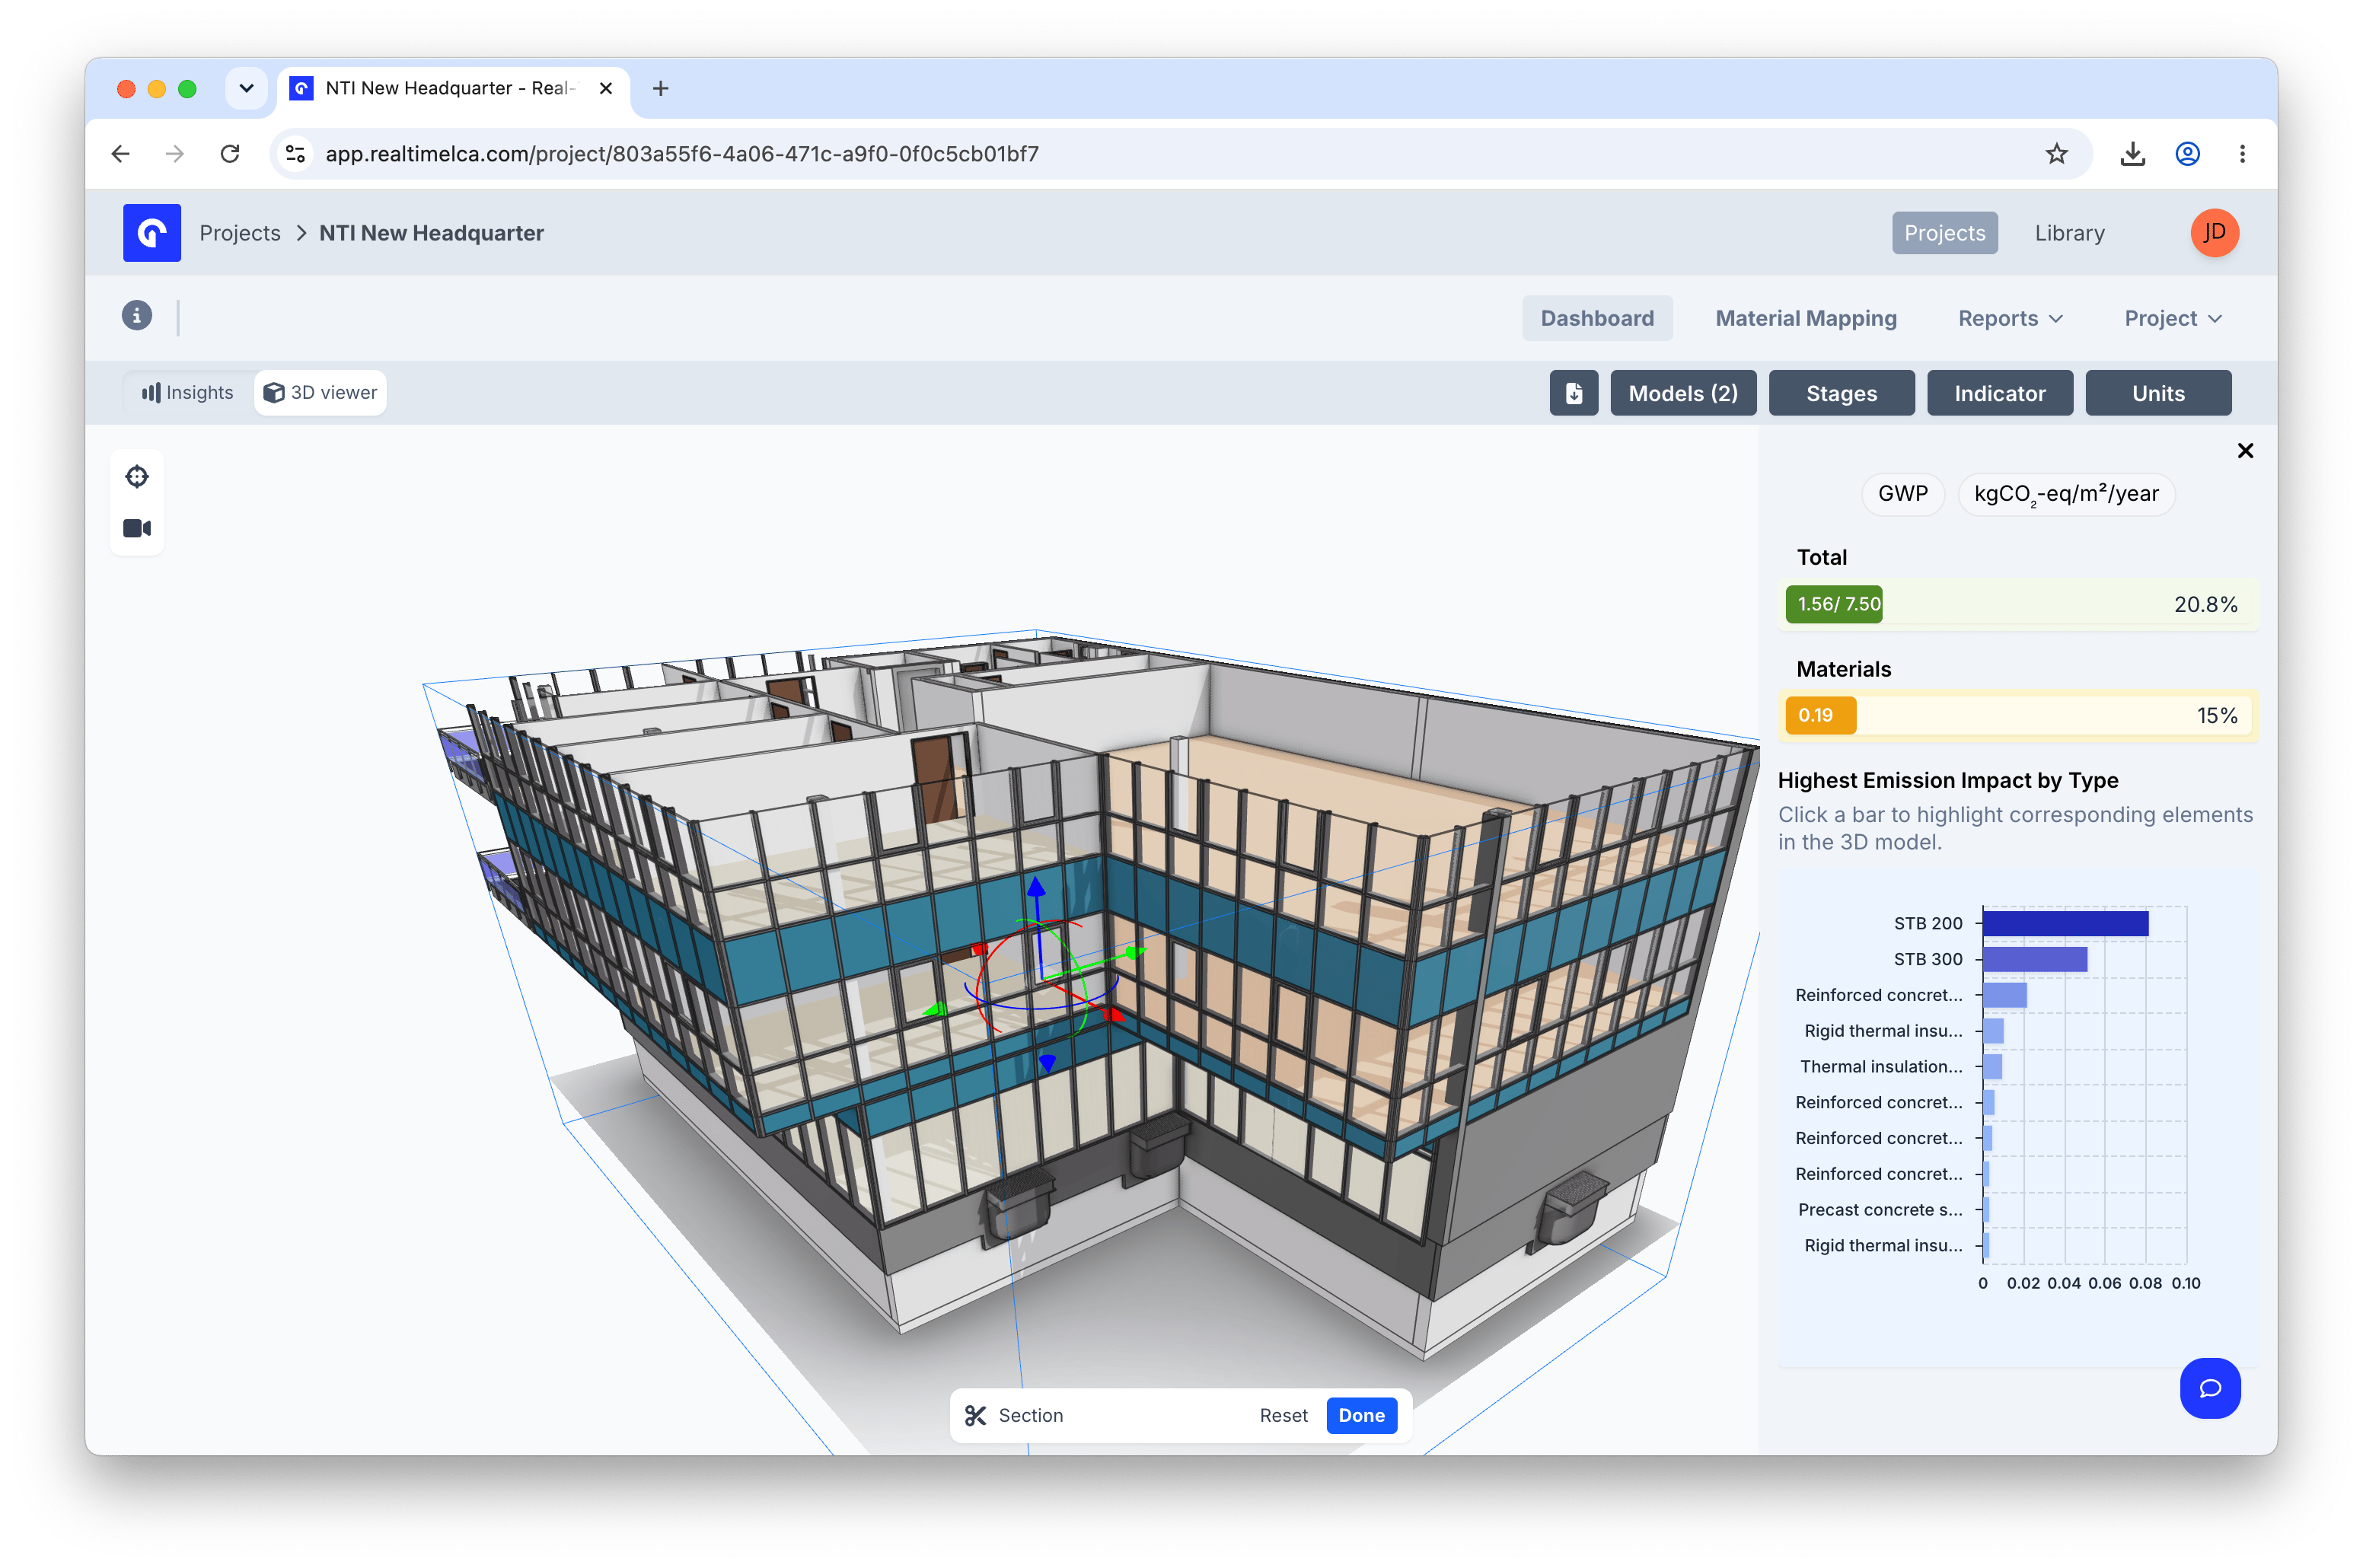
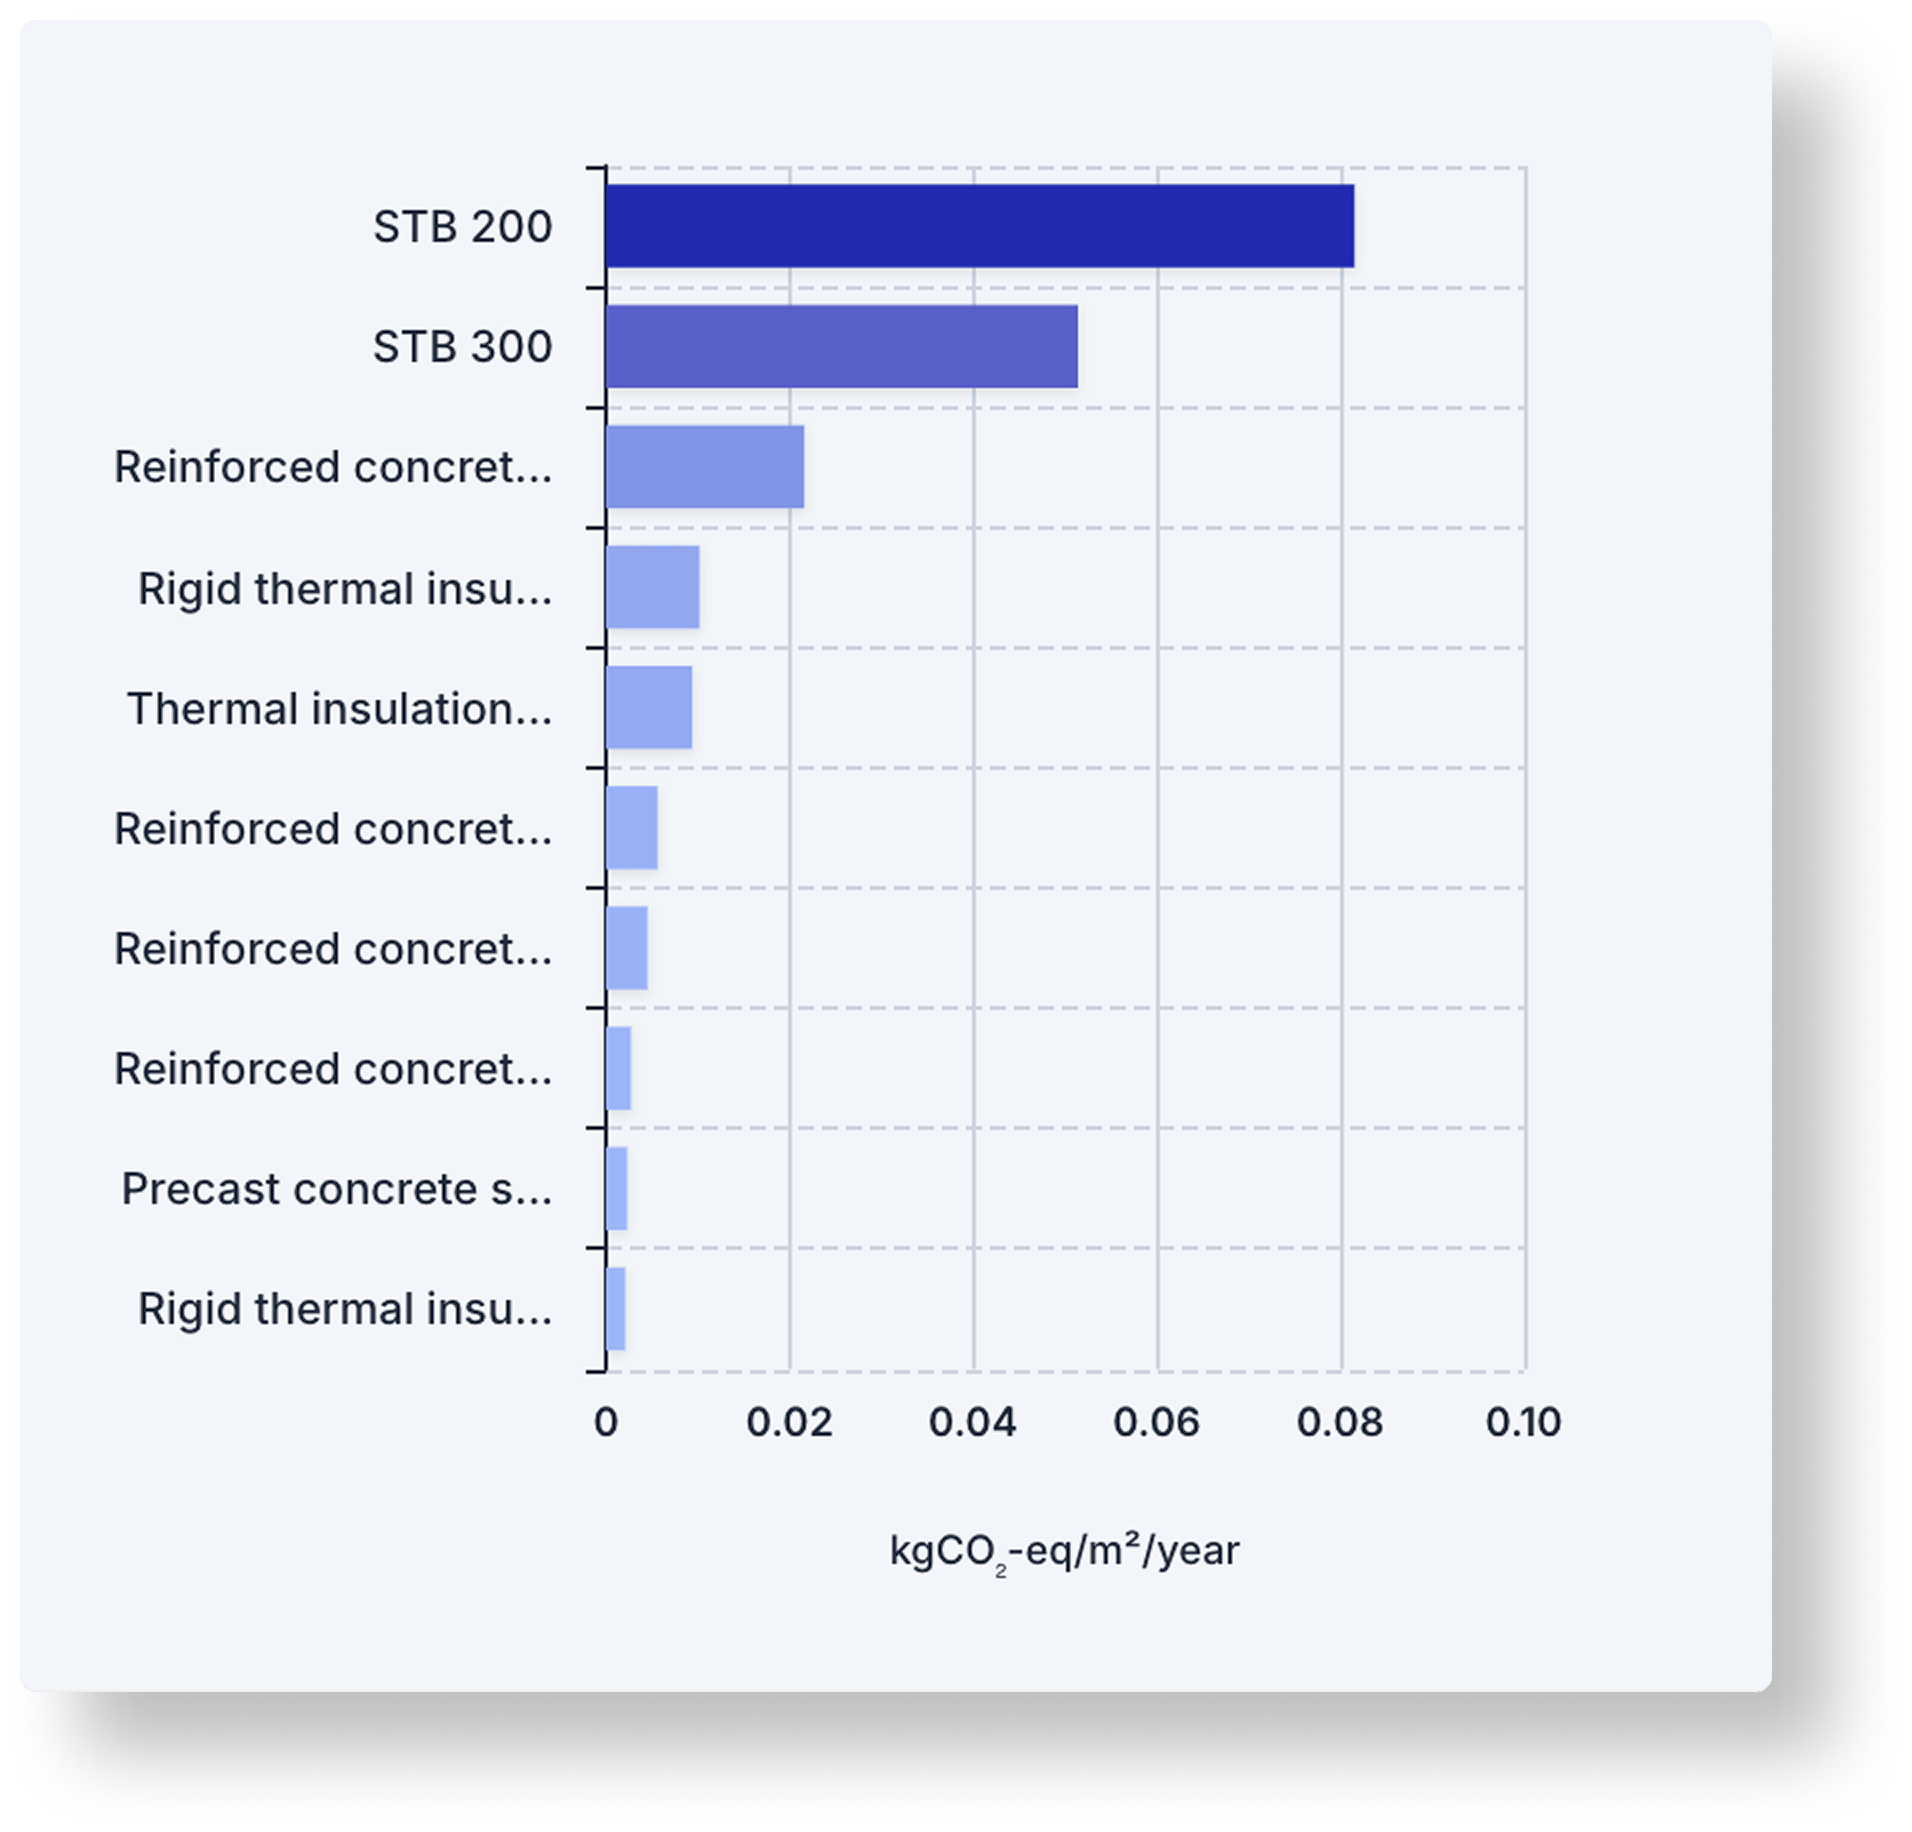
Highest Emission Impact by Material
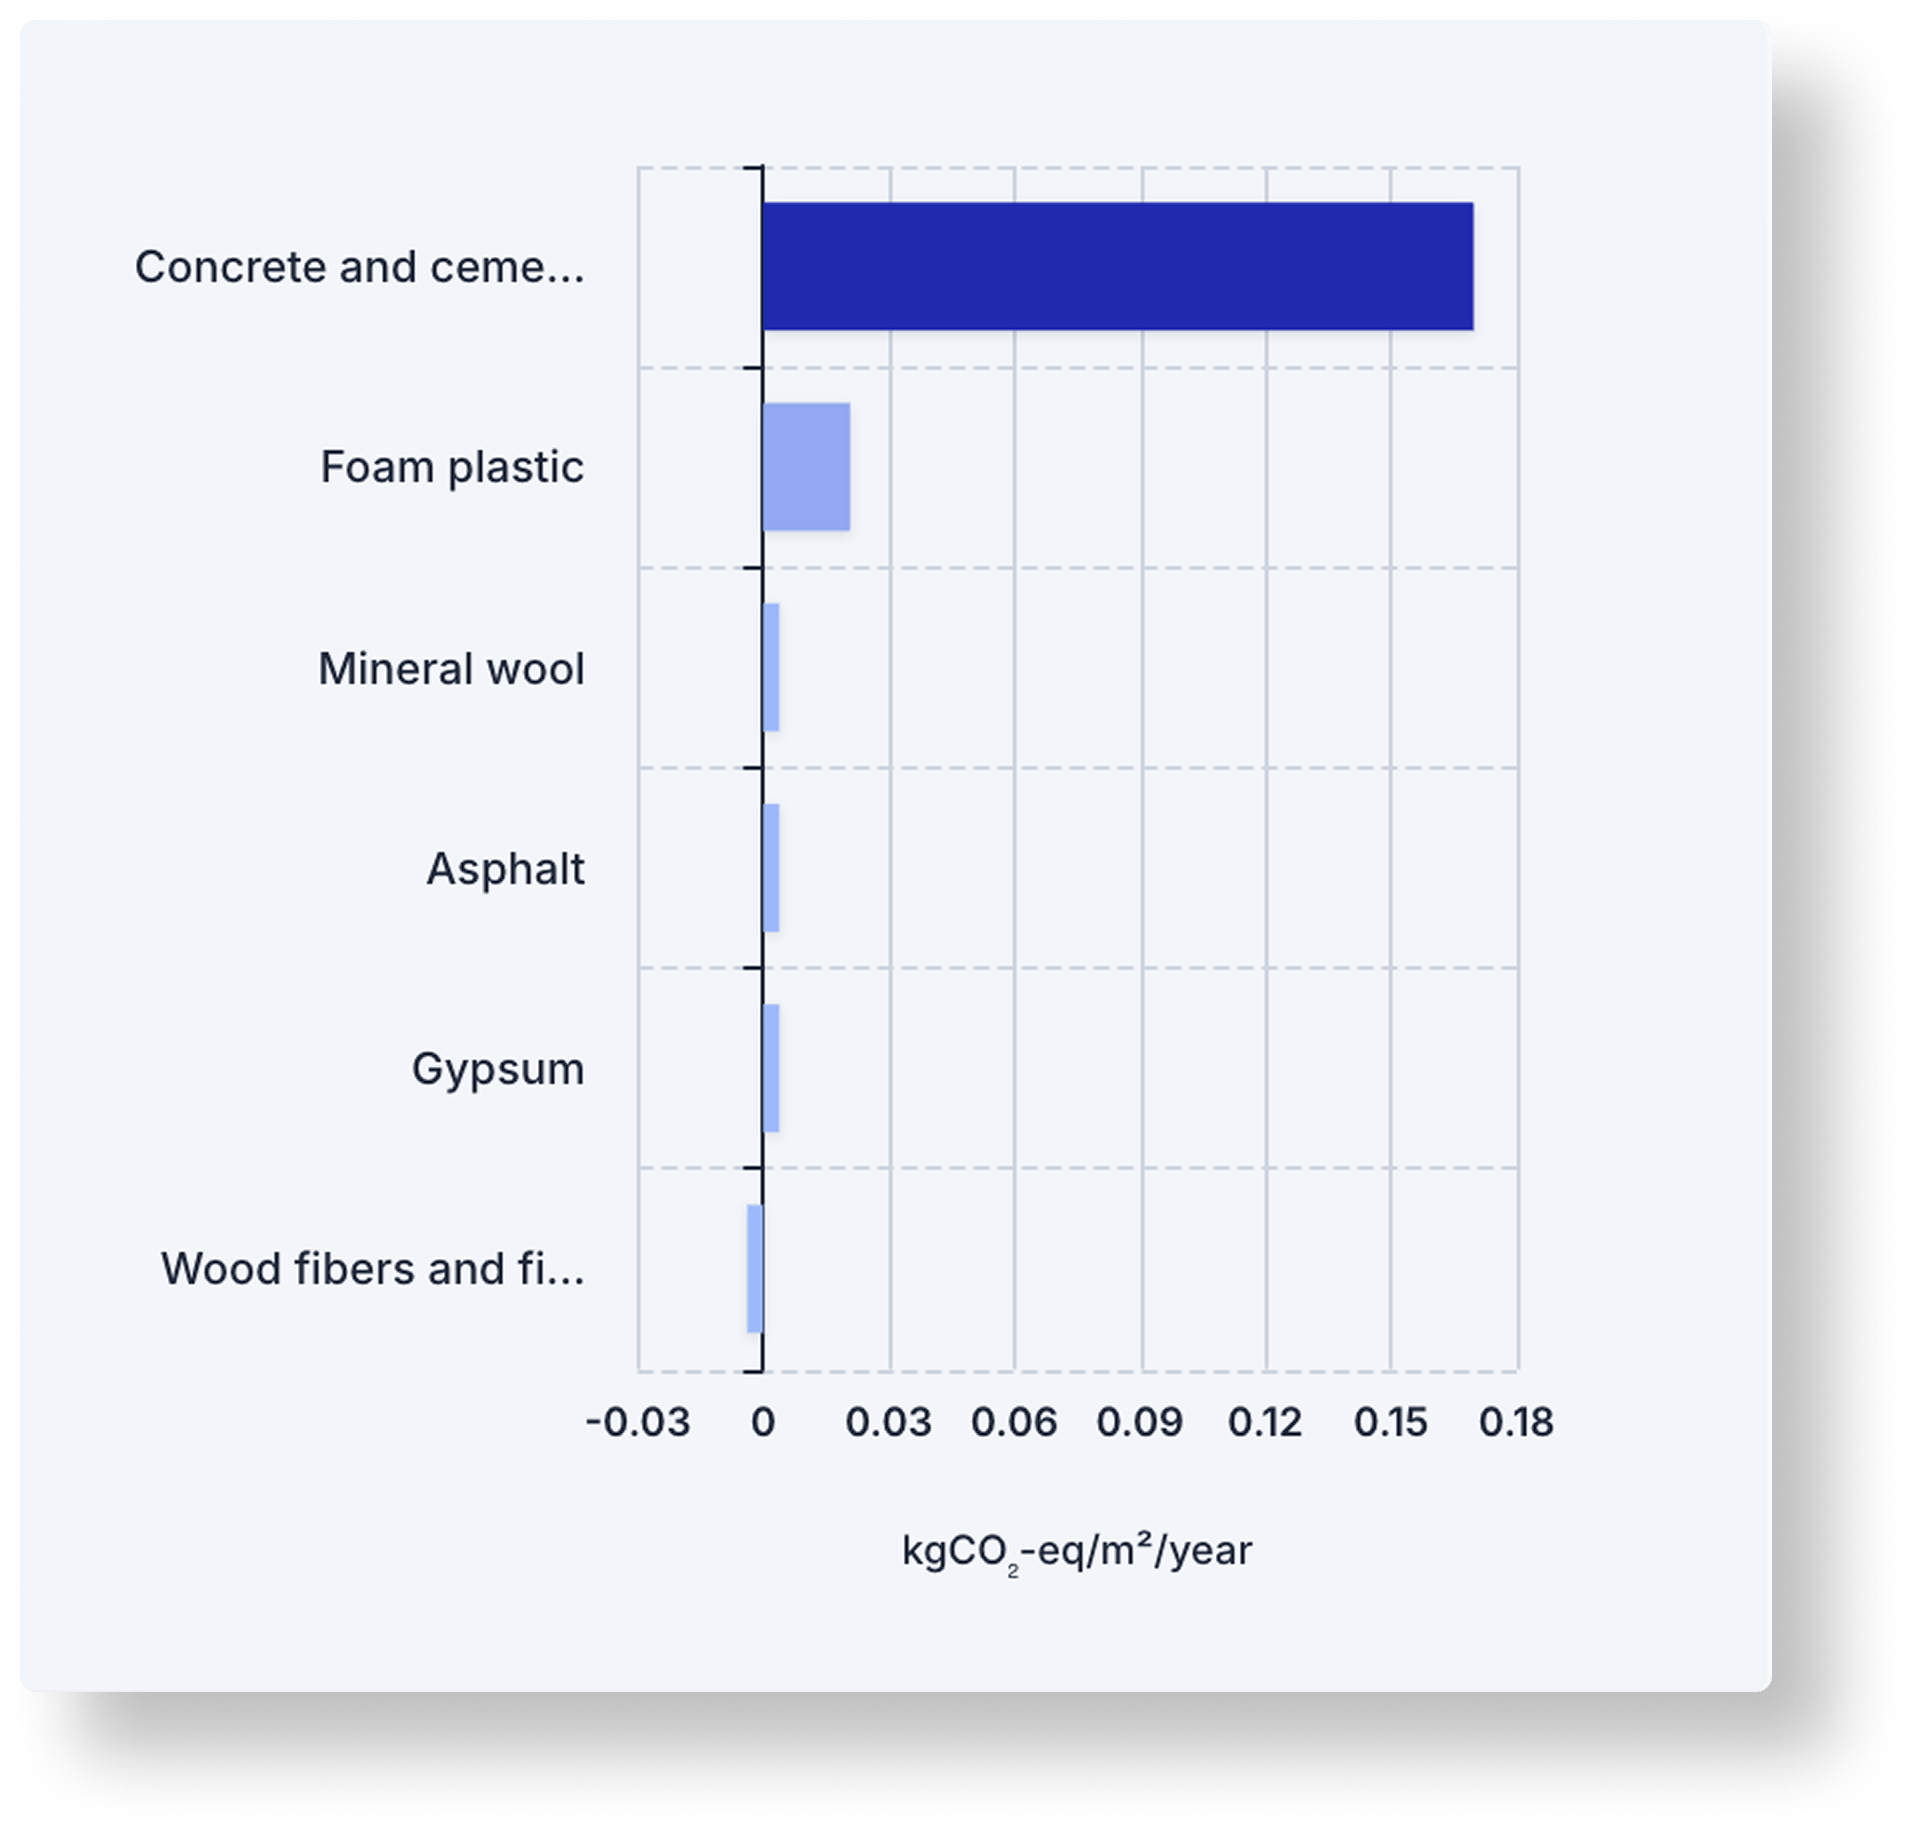
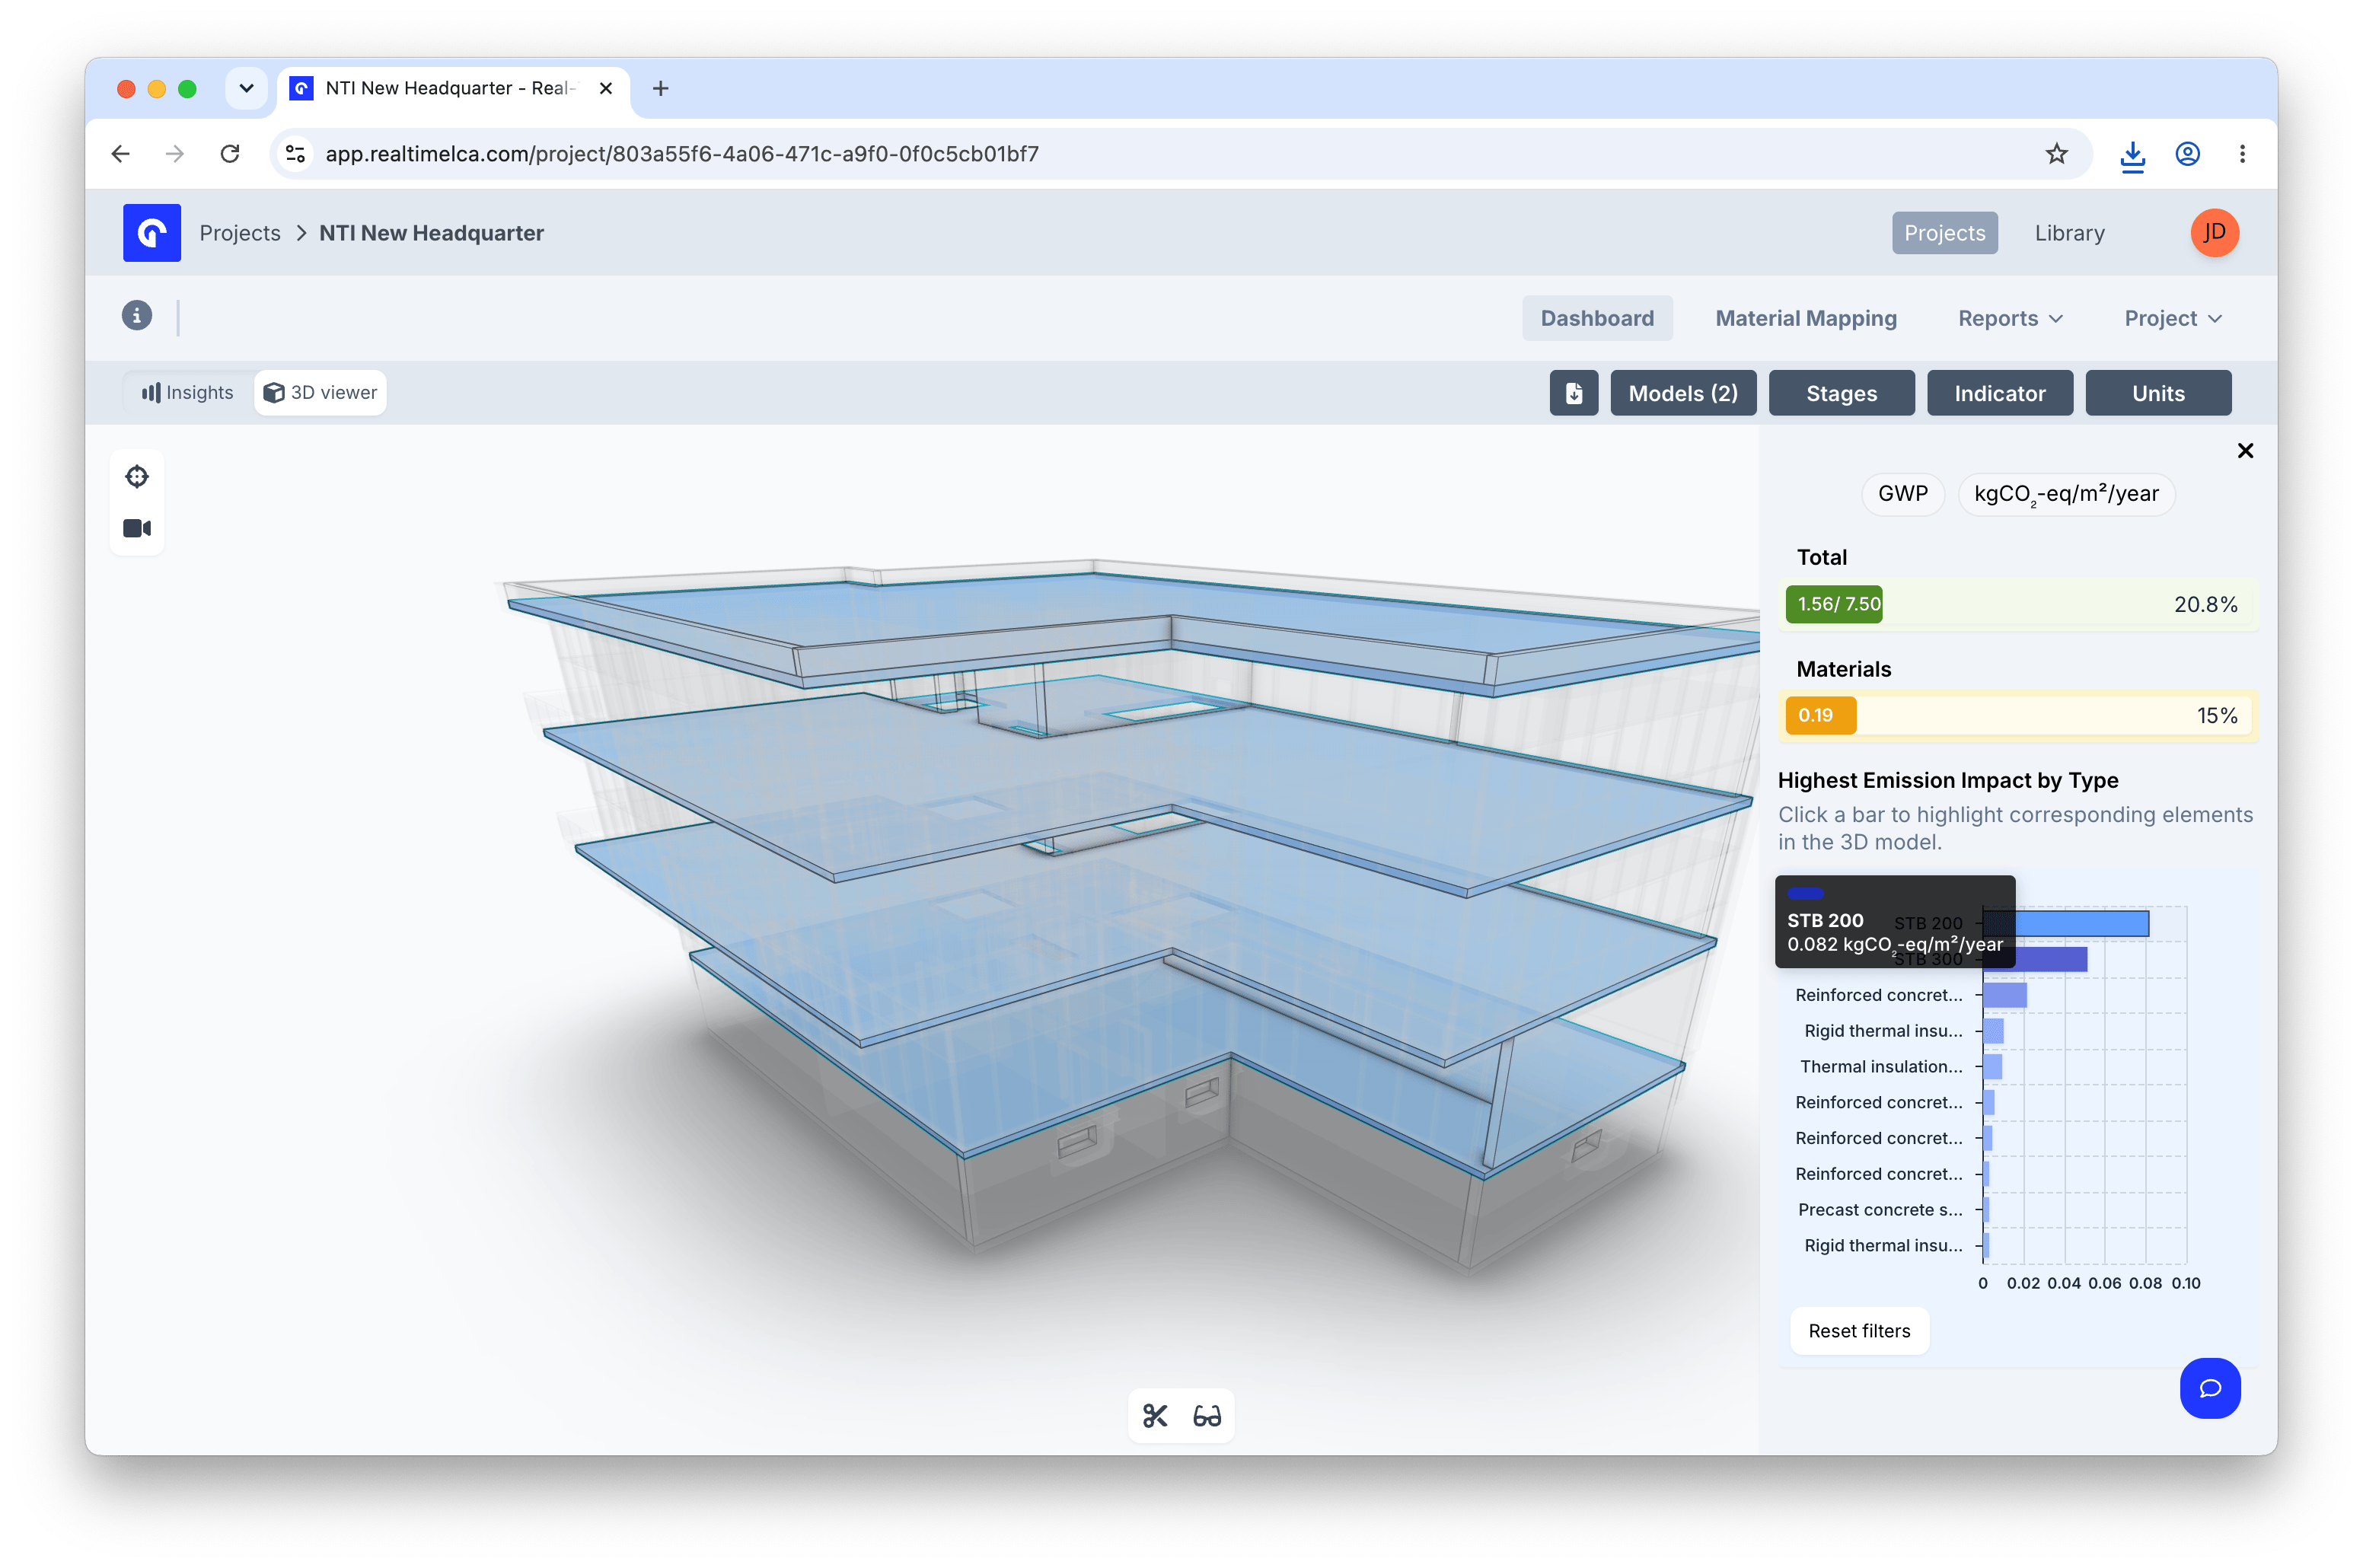
Highest Emission Impact by Type
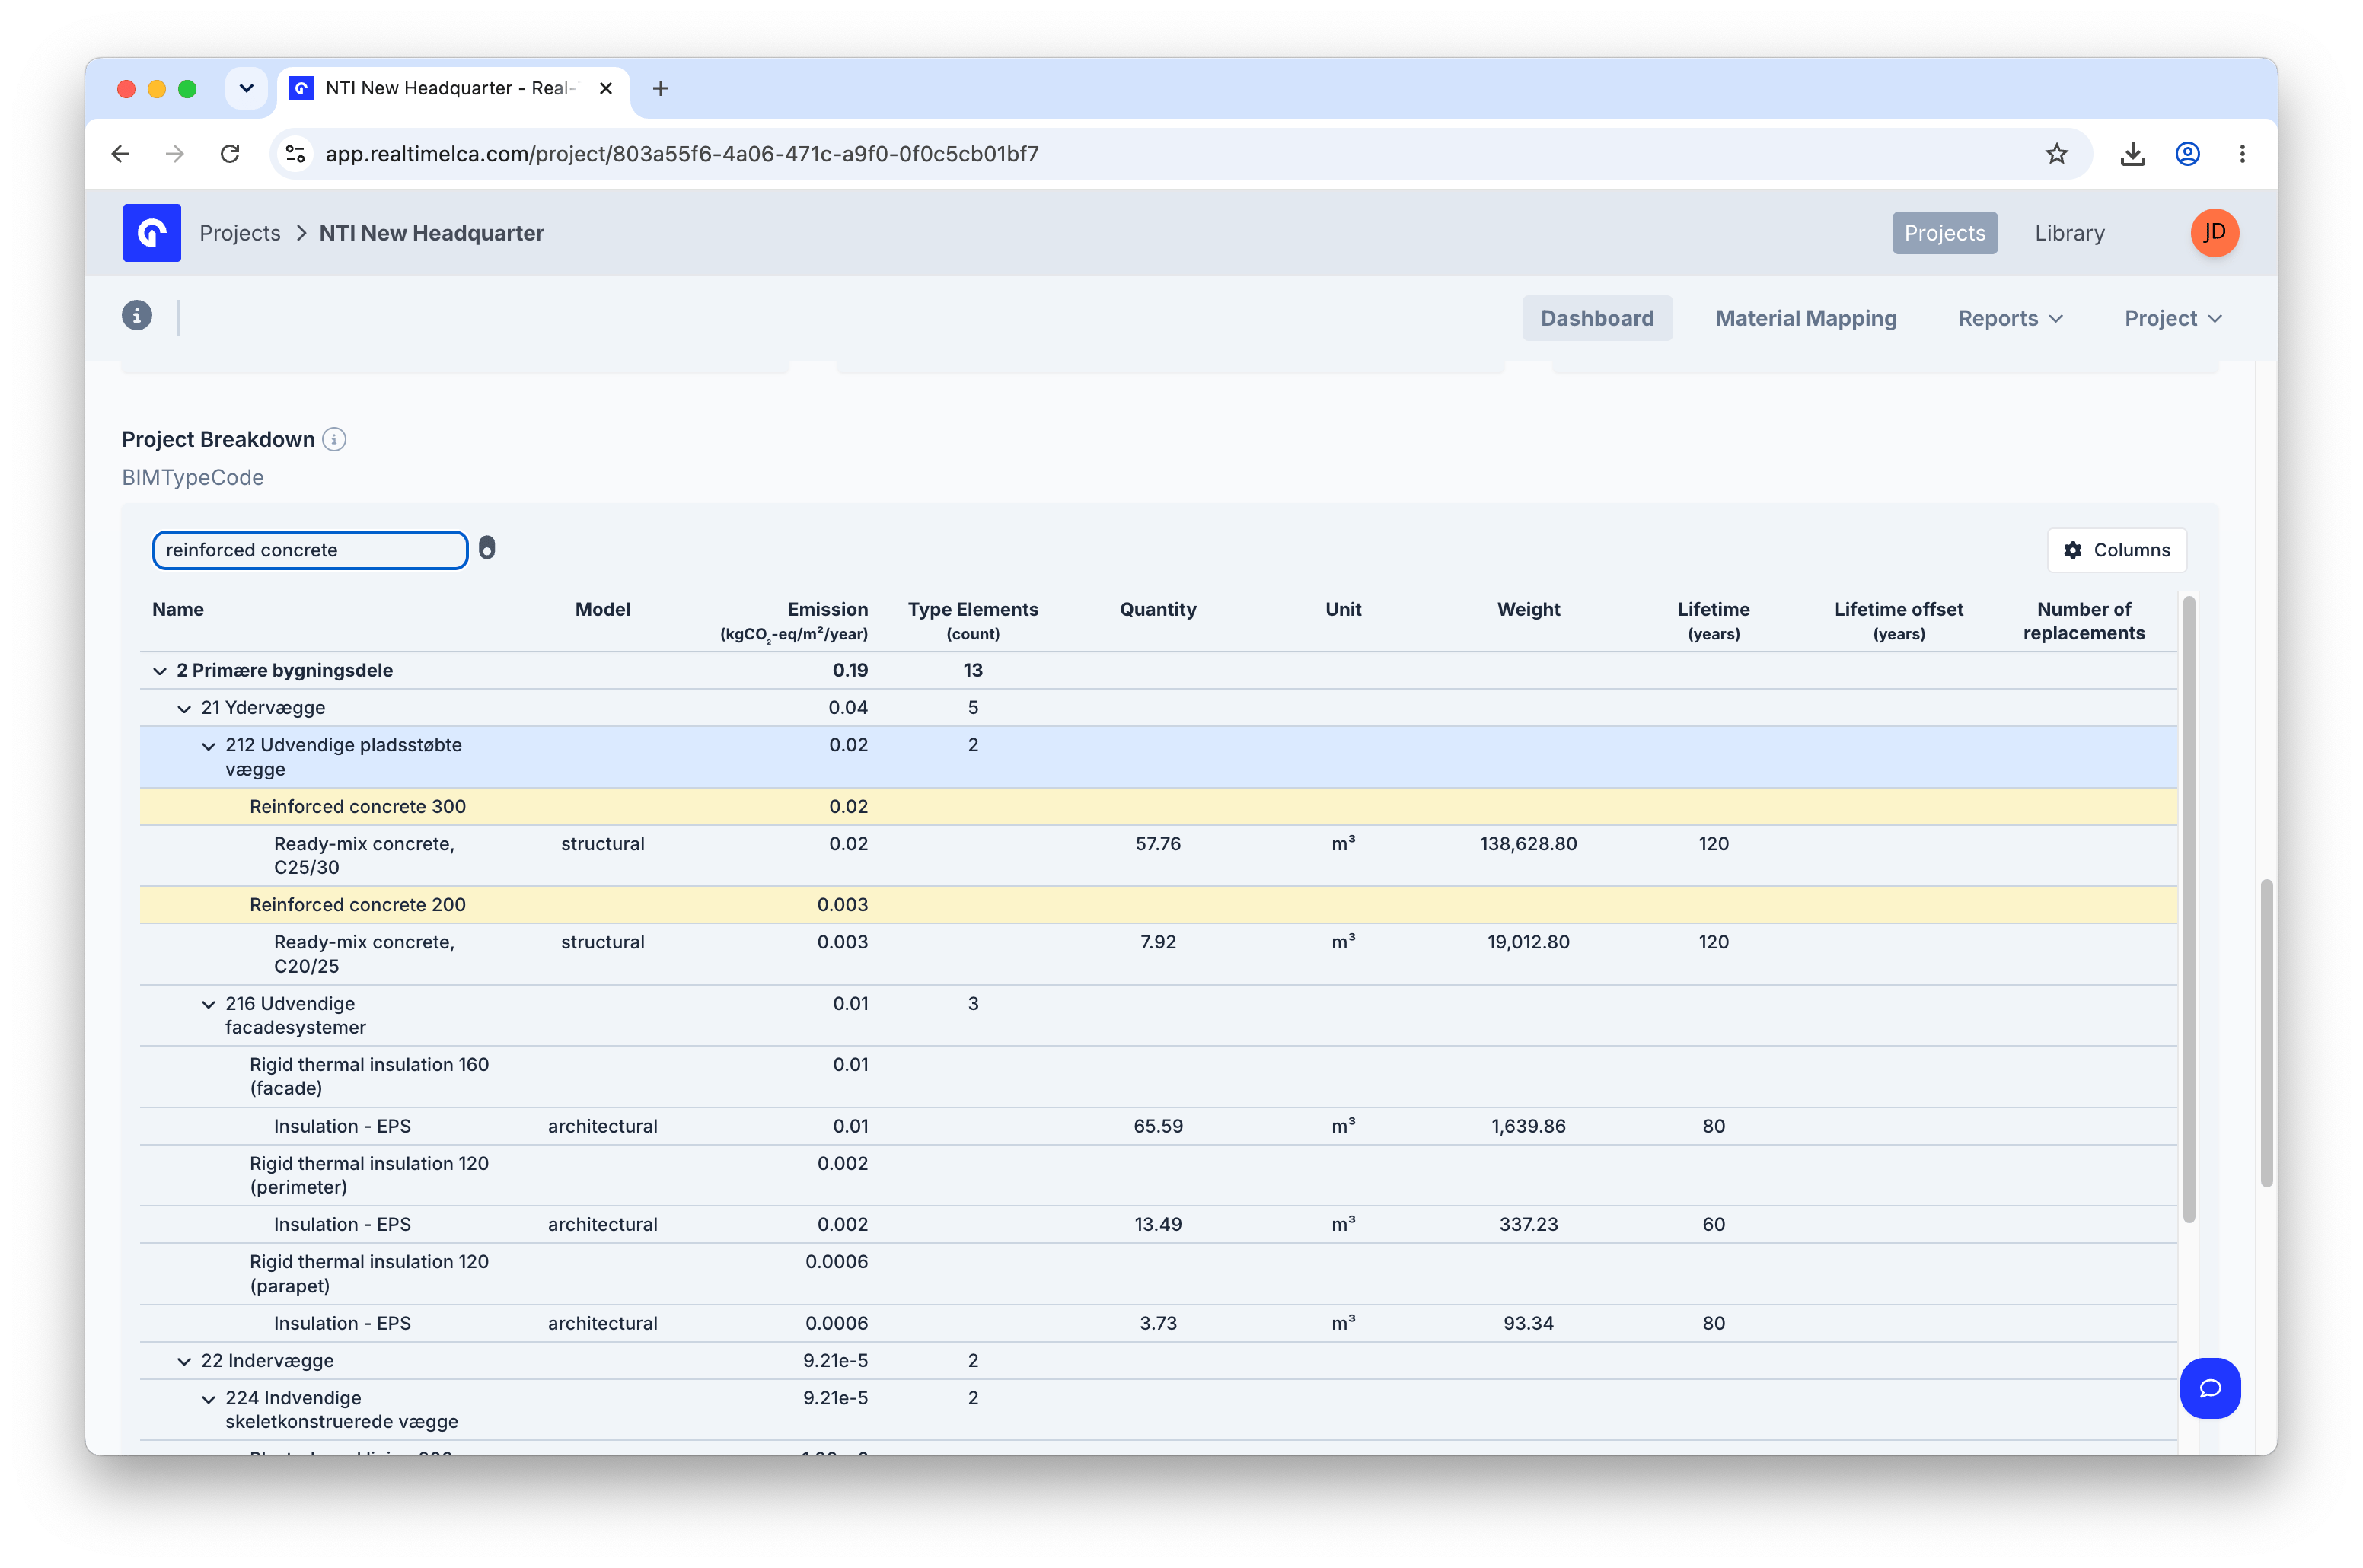
Project Breakdown
Project Breakdown shows the total emissions for your project, divided into building parts where all material data is listed. You can click on each building part to inspect the materials included in the inventory and explore their detailed emissions.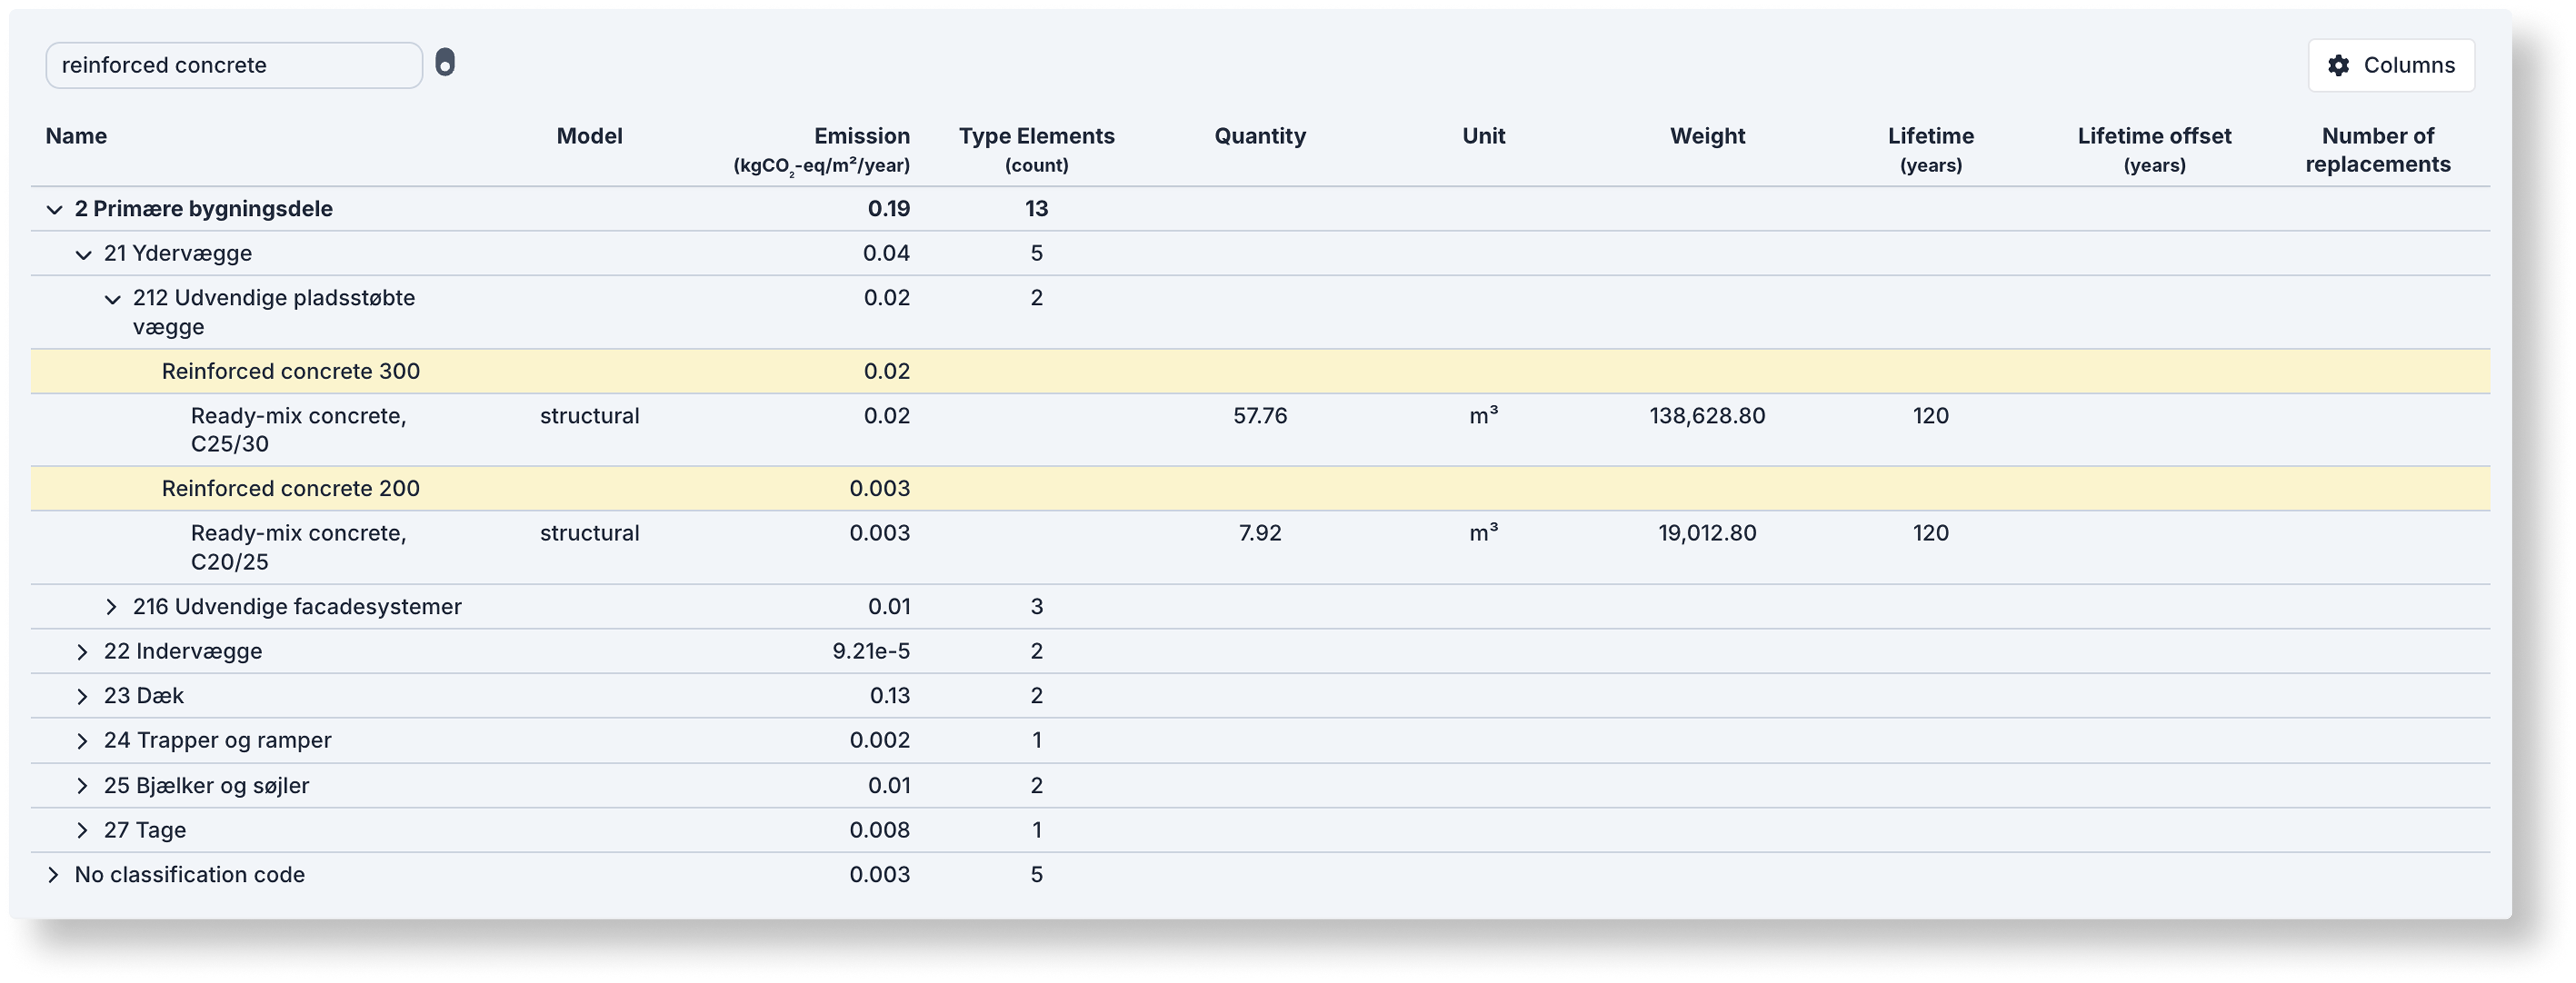
Emission is the sum of all included stages and might therefore deviate from the Emission overview.
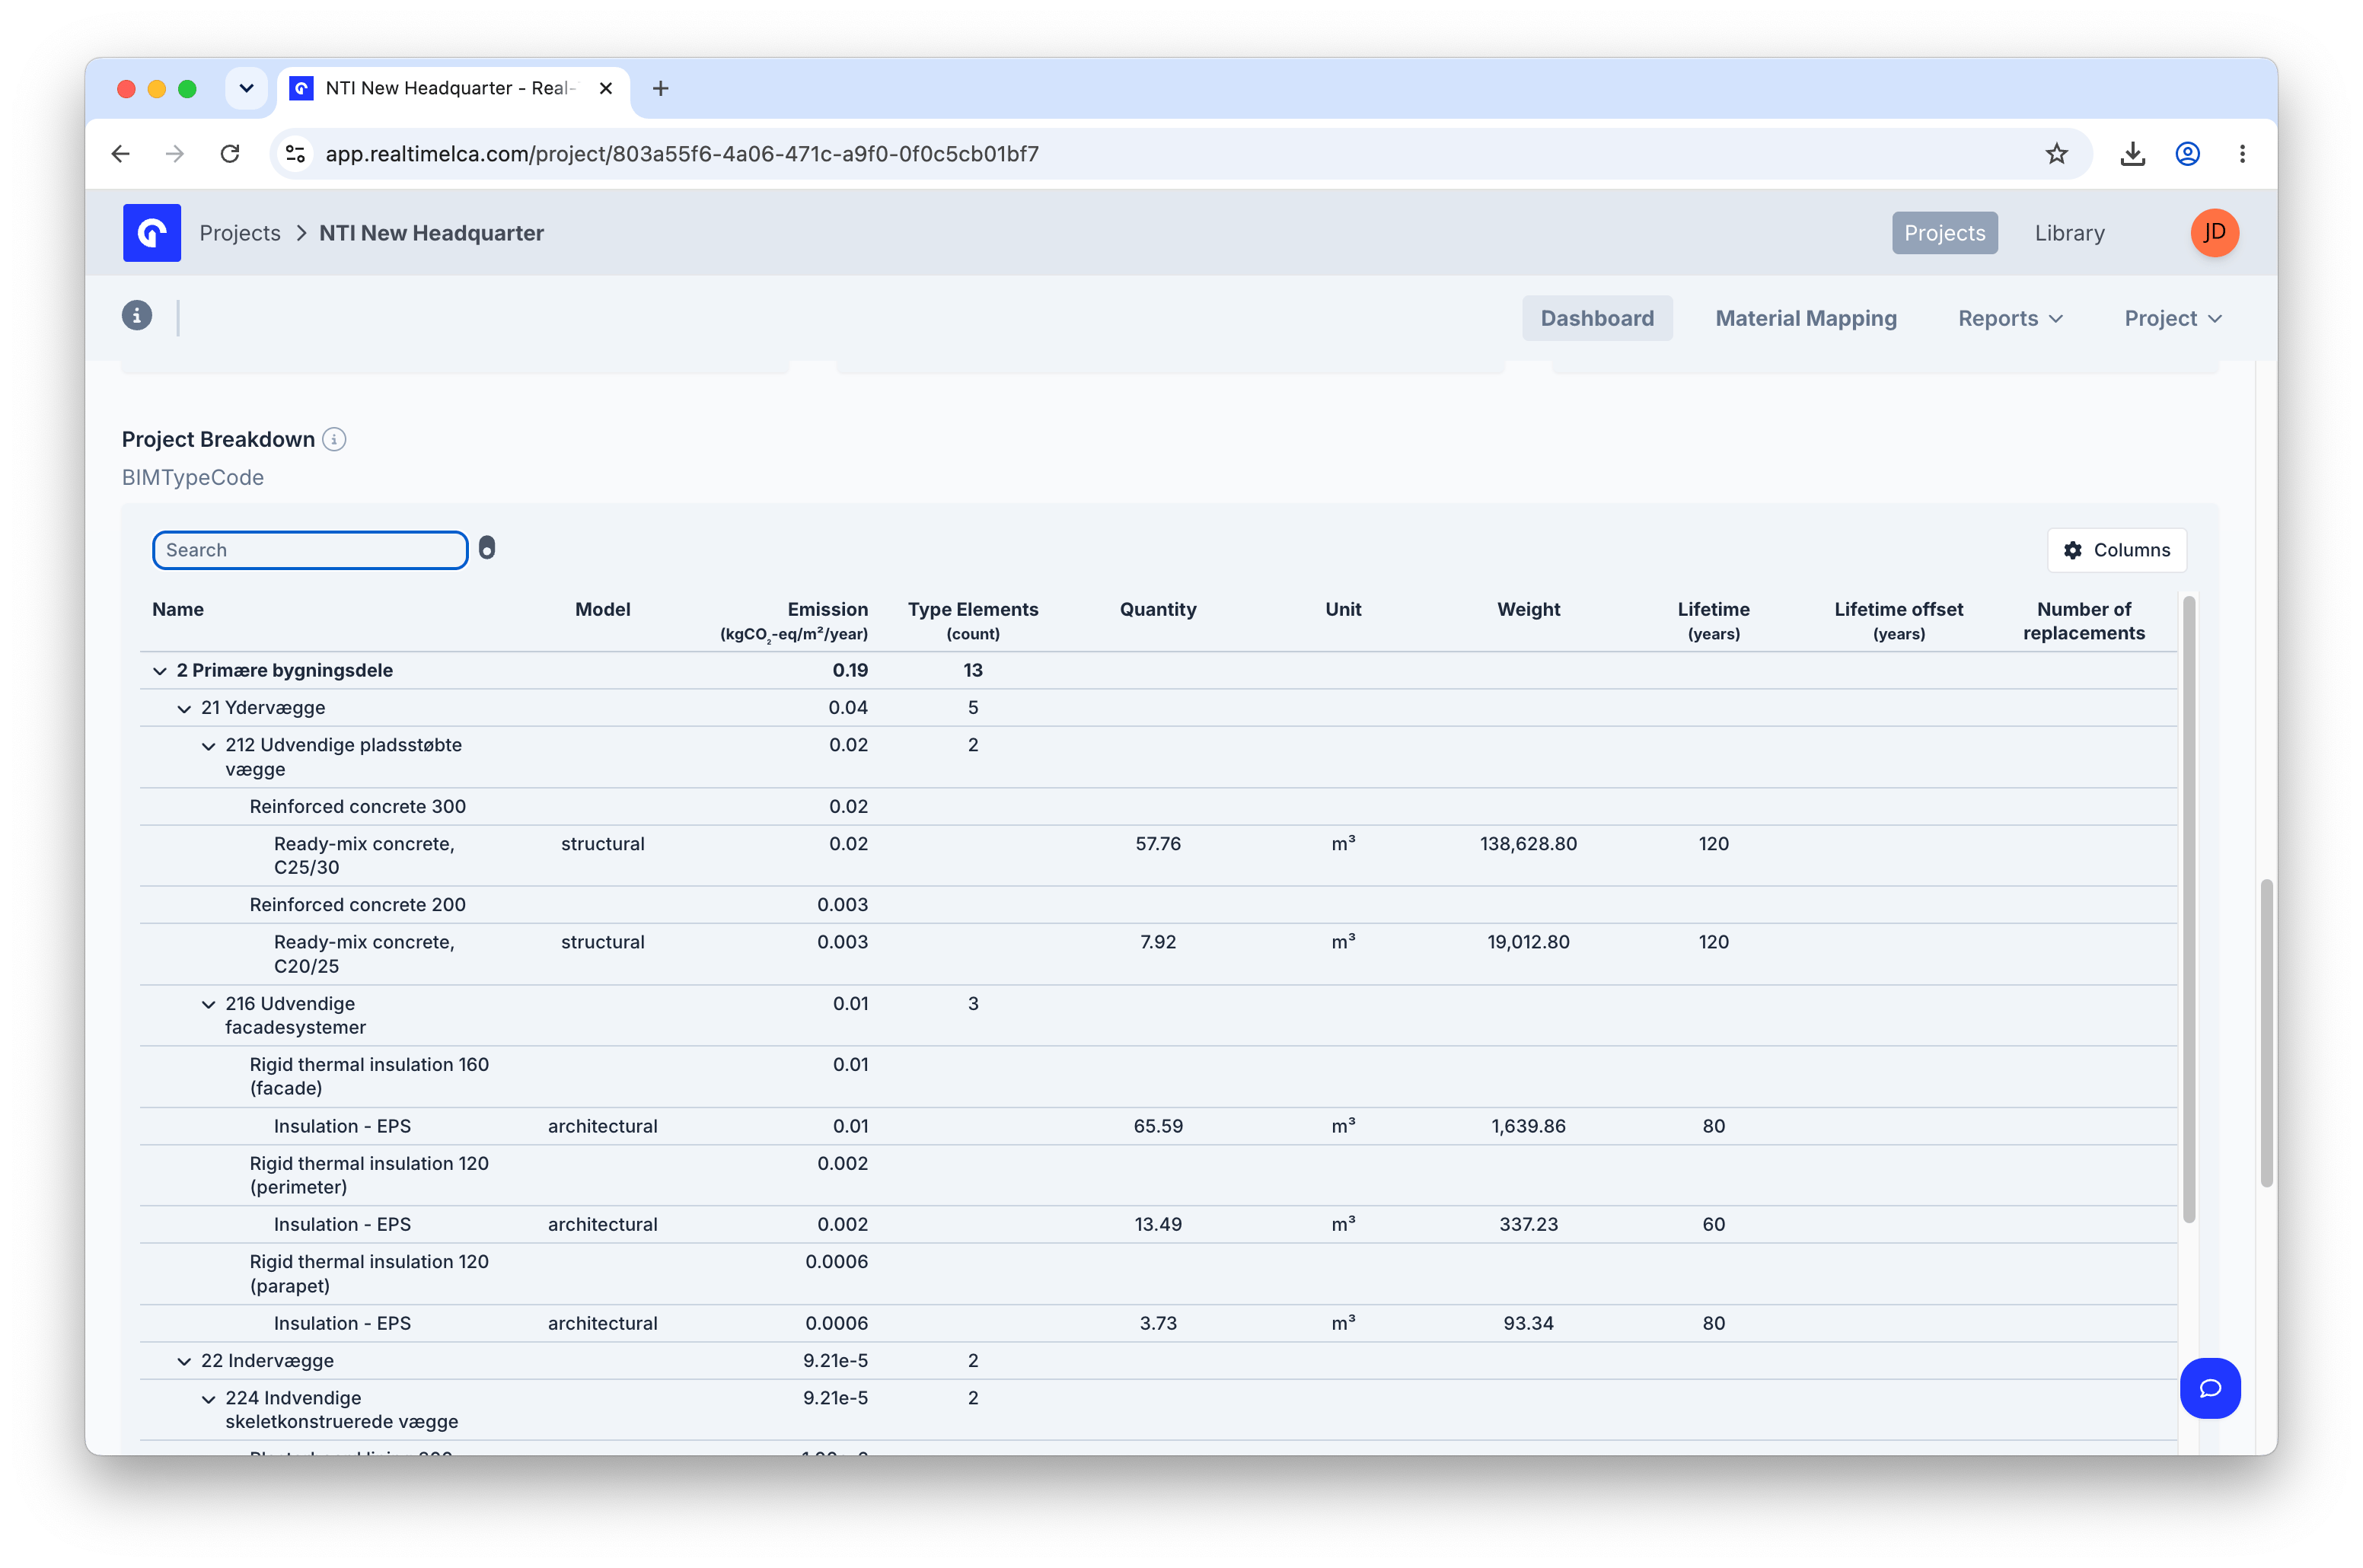
Search
Expanded
Columns reorder
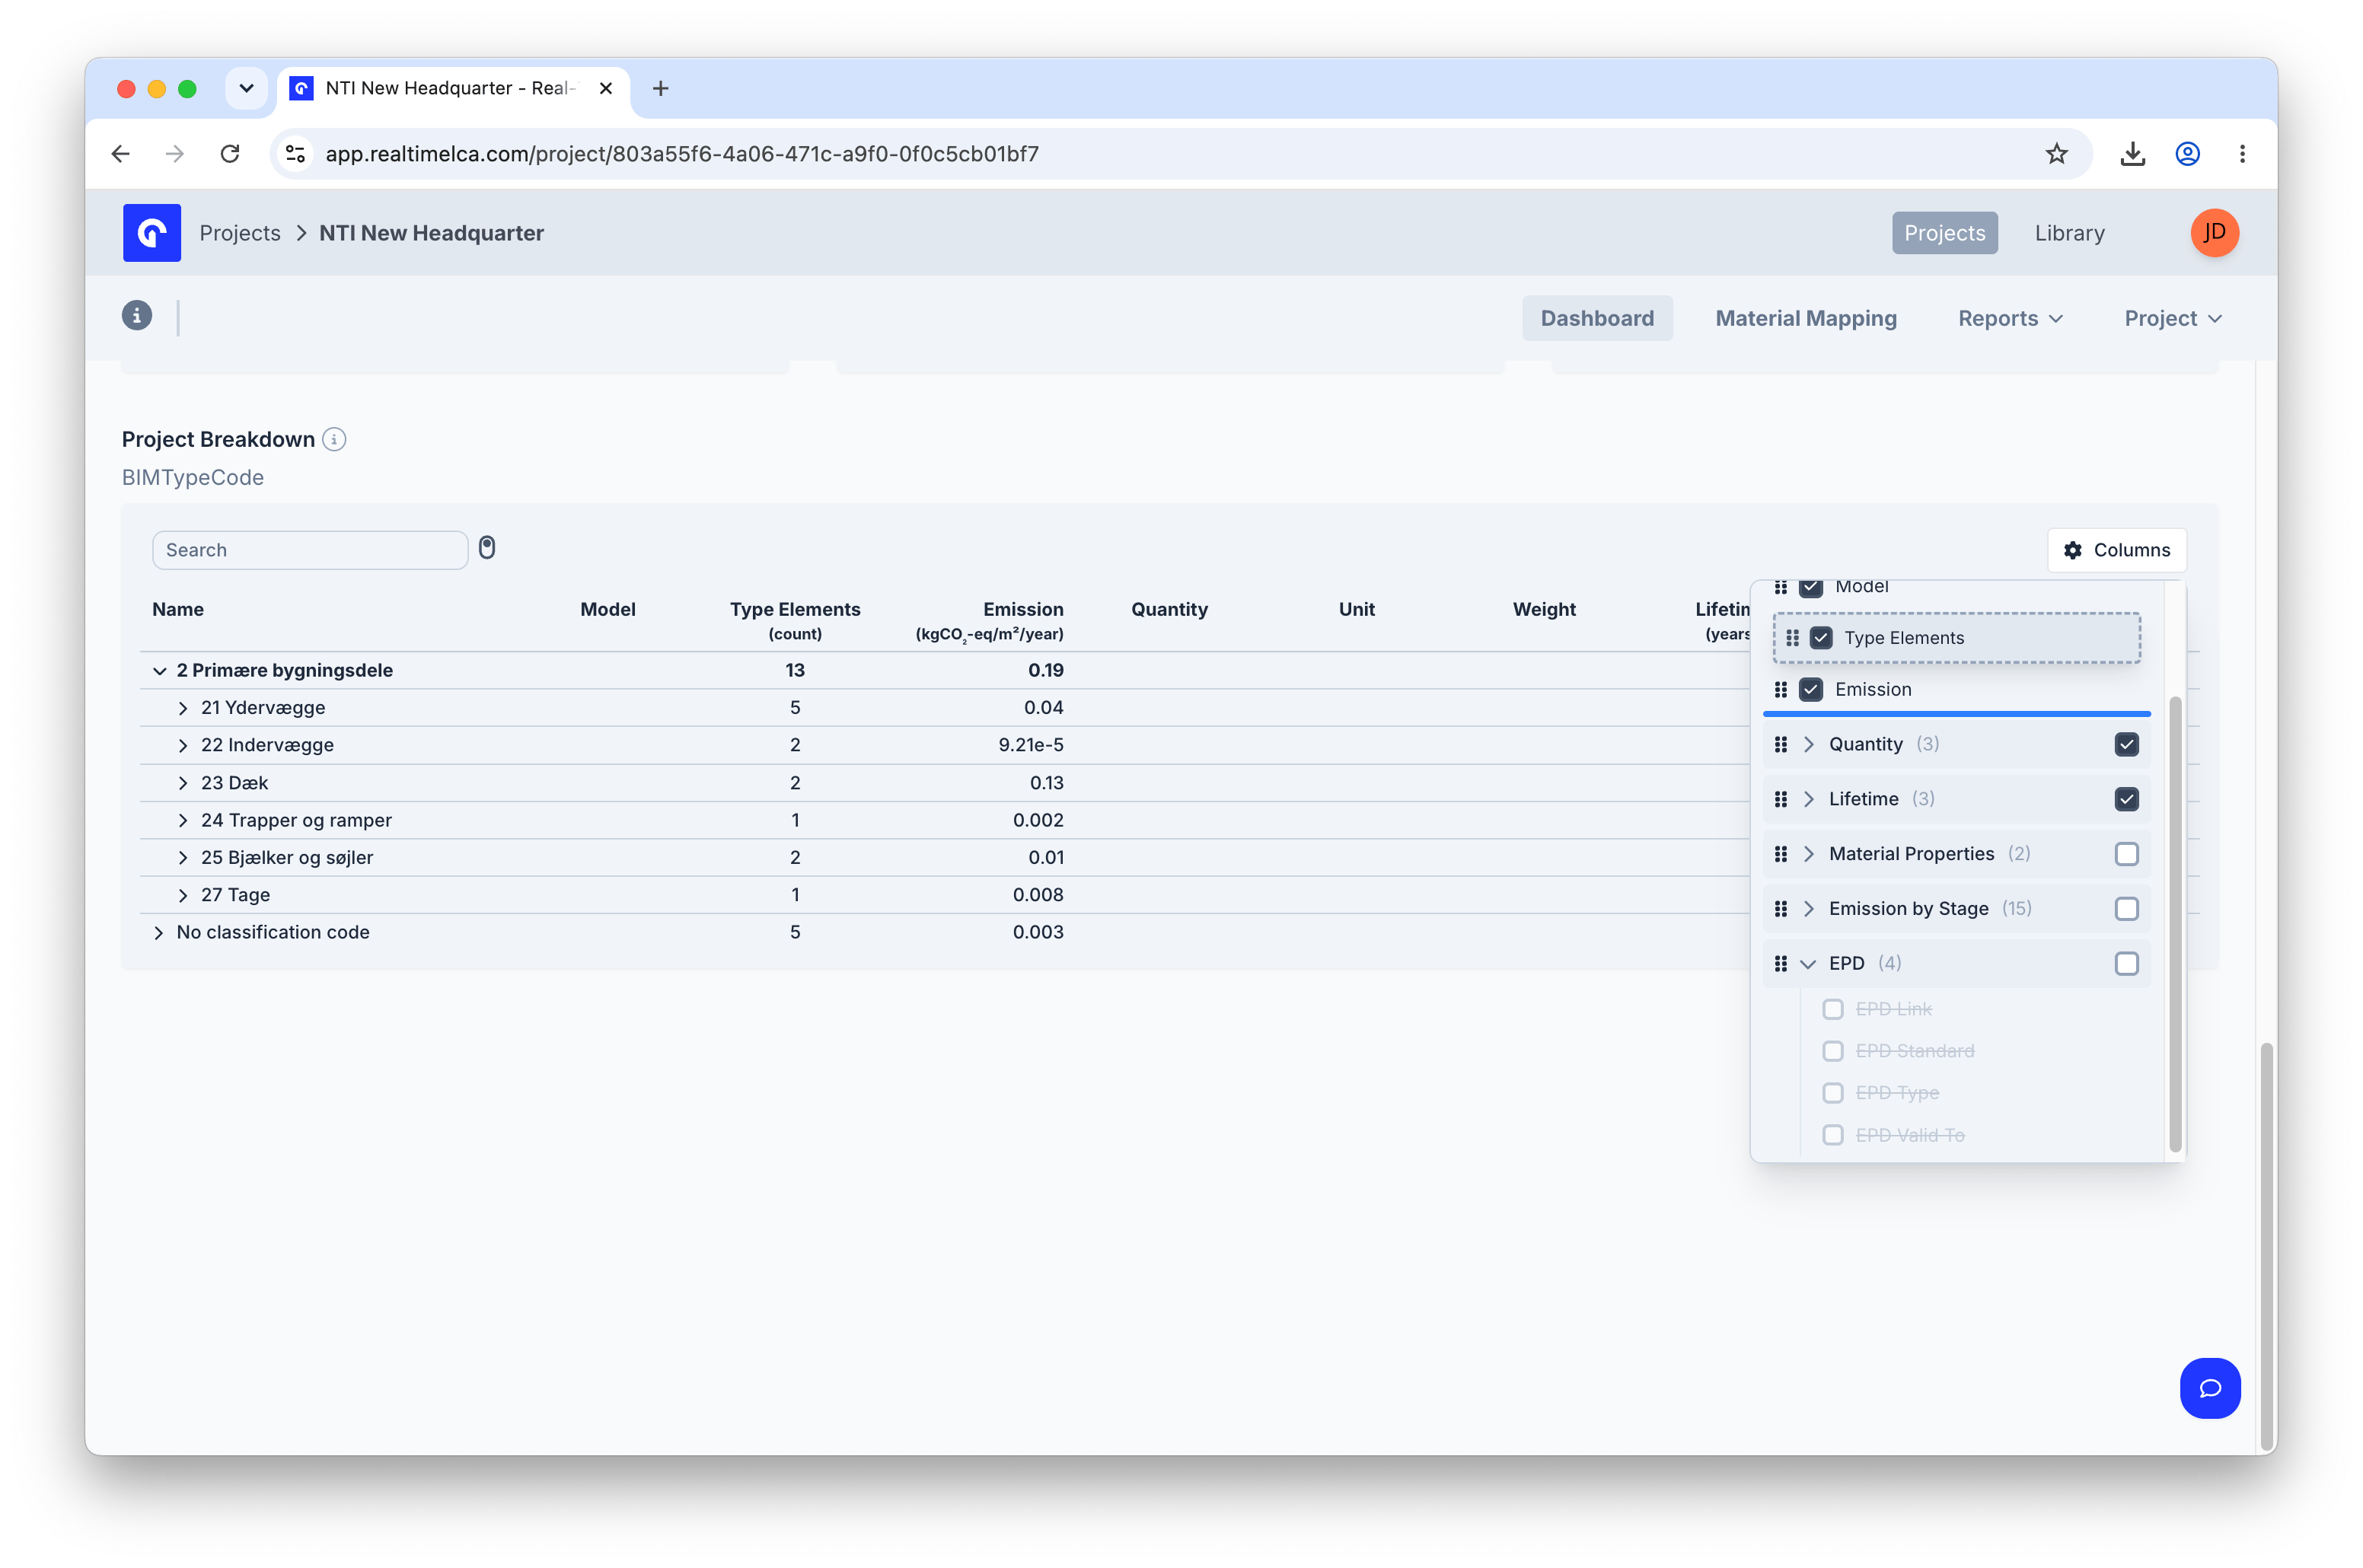
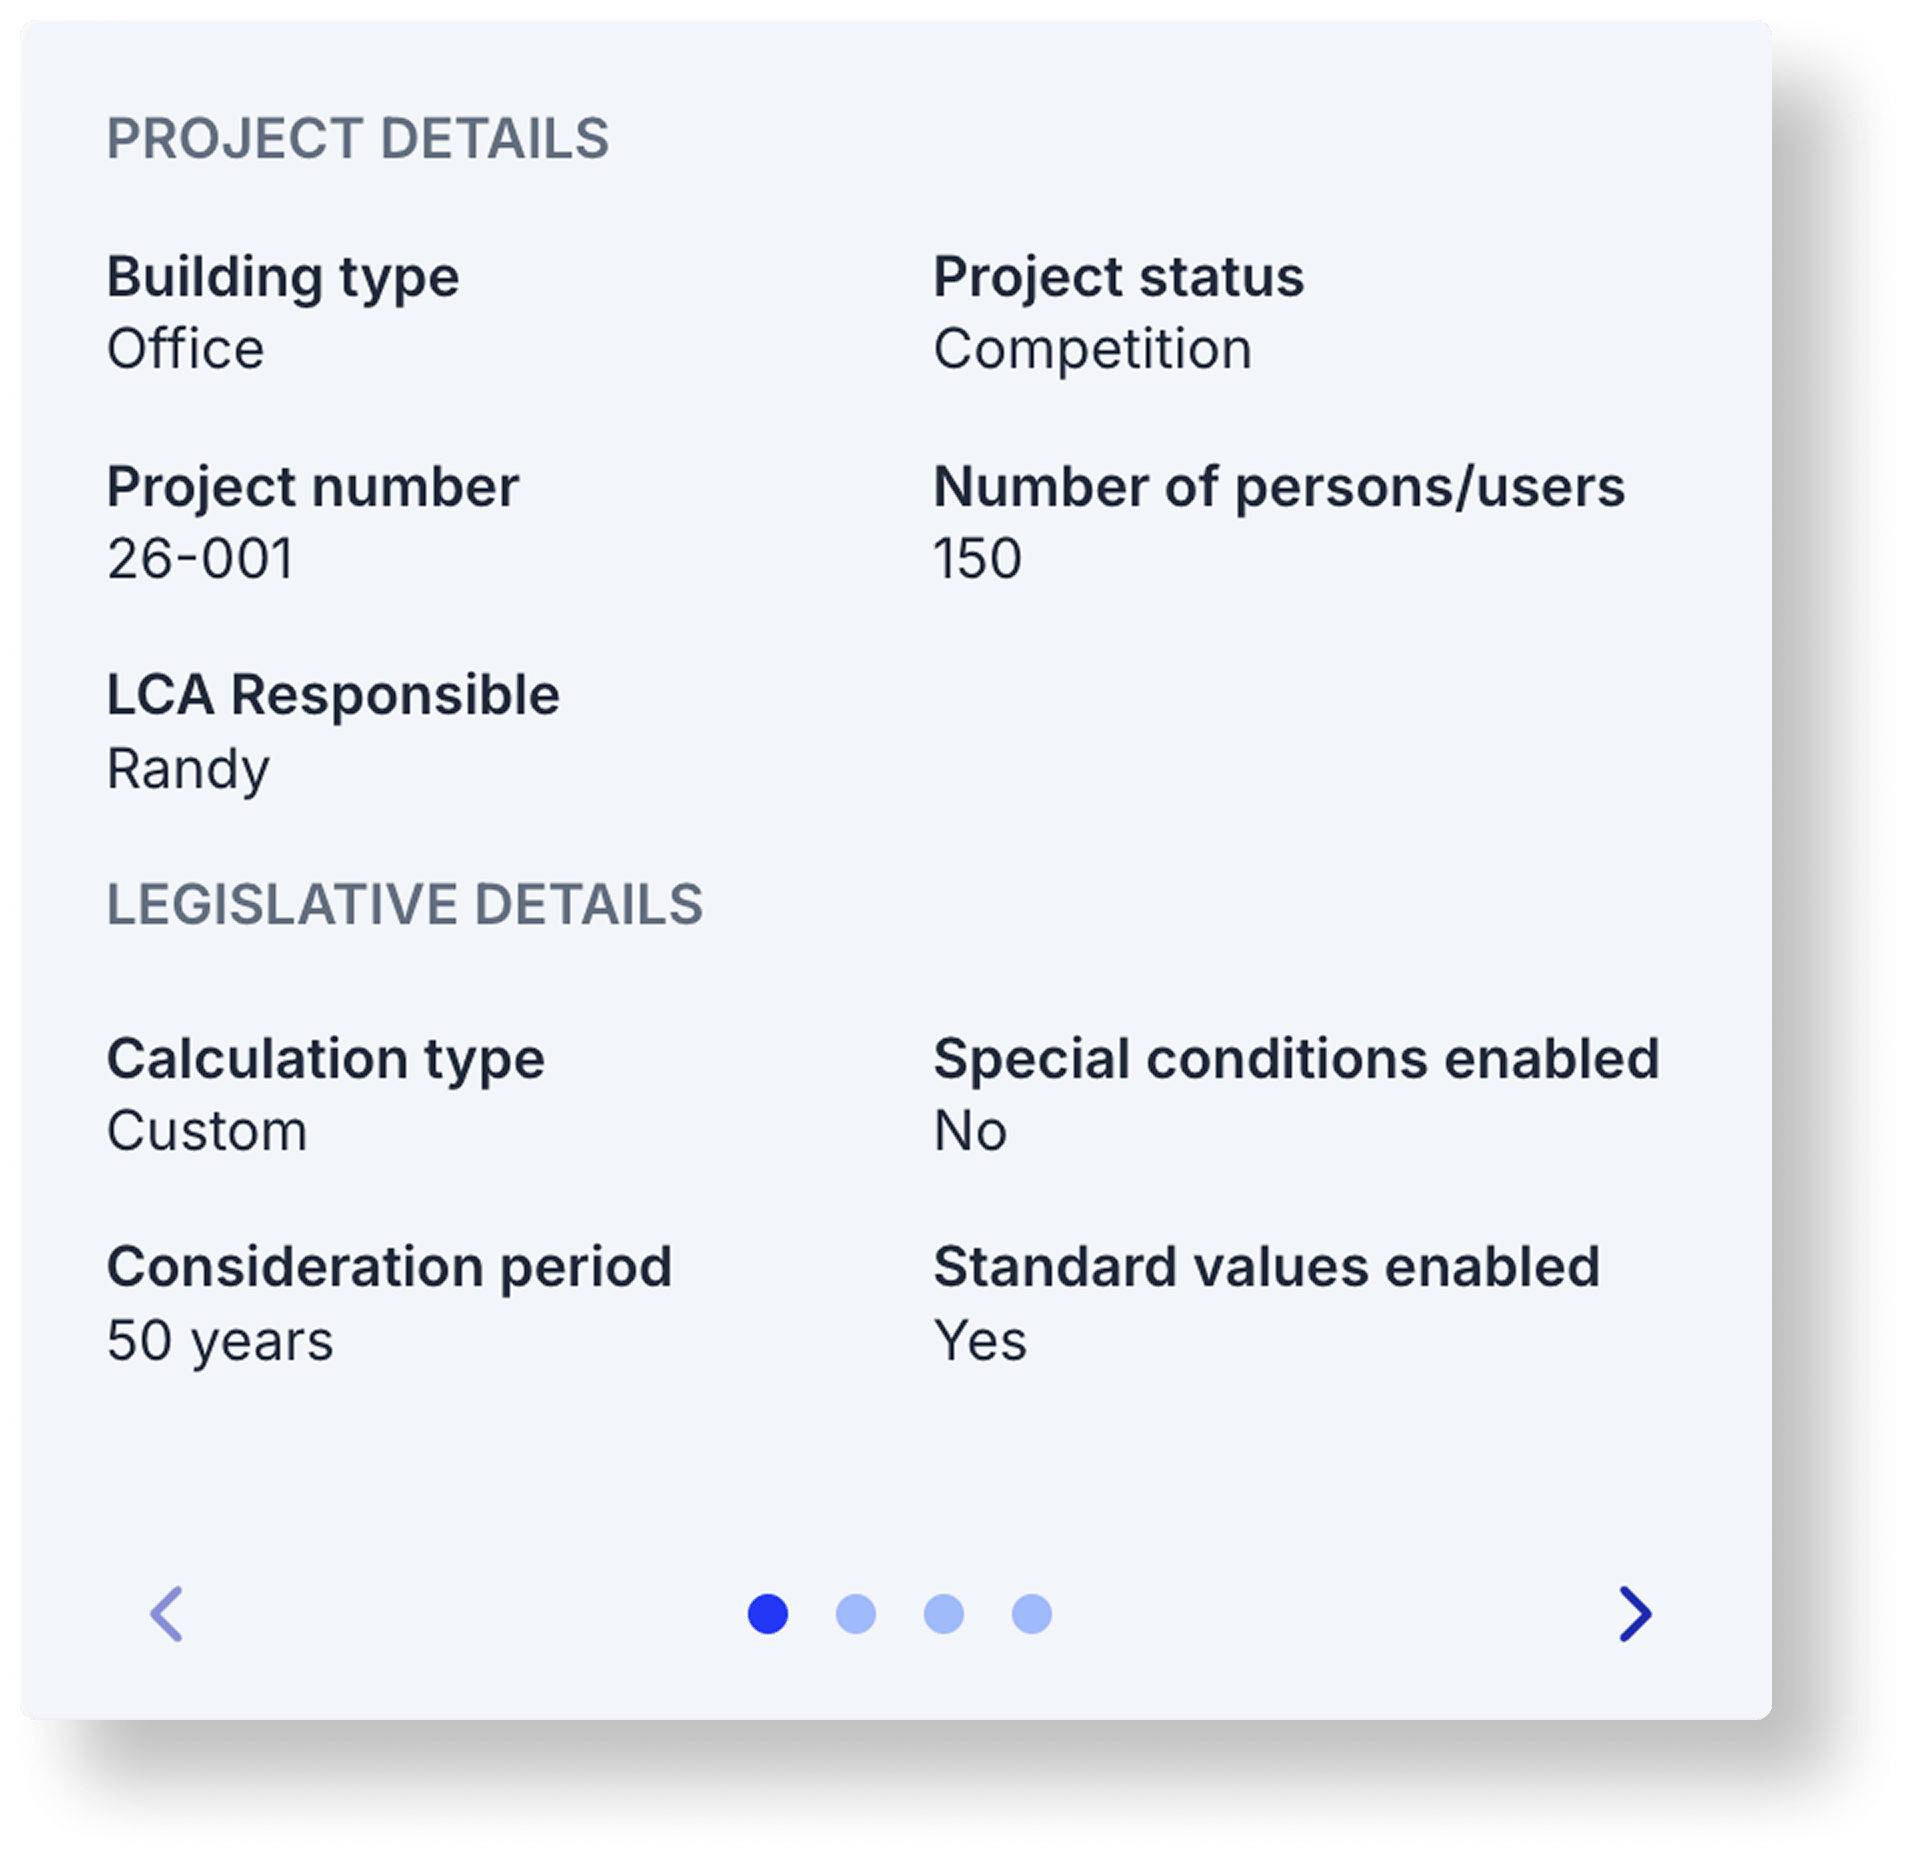
Project data
Reports
The Reports tab in the dashboard header opens a dropdown of frameworks available for the project’s location.Dropdown
Downloading
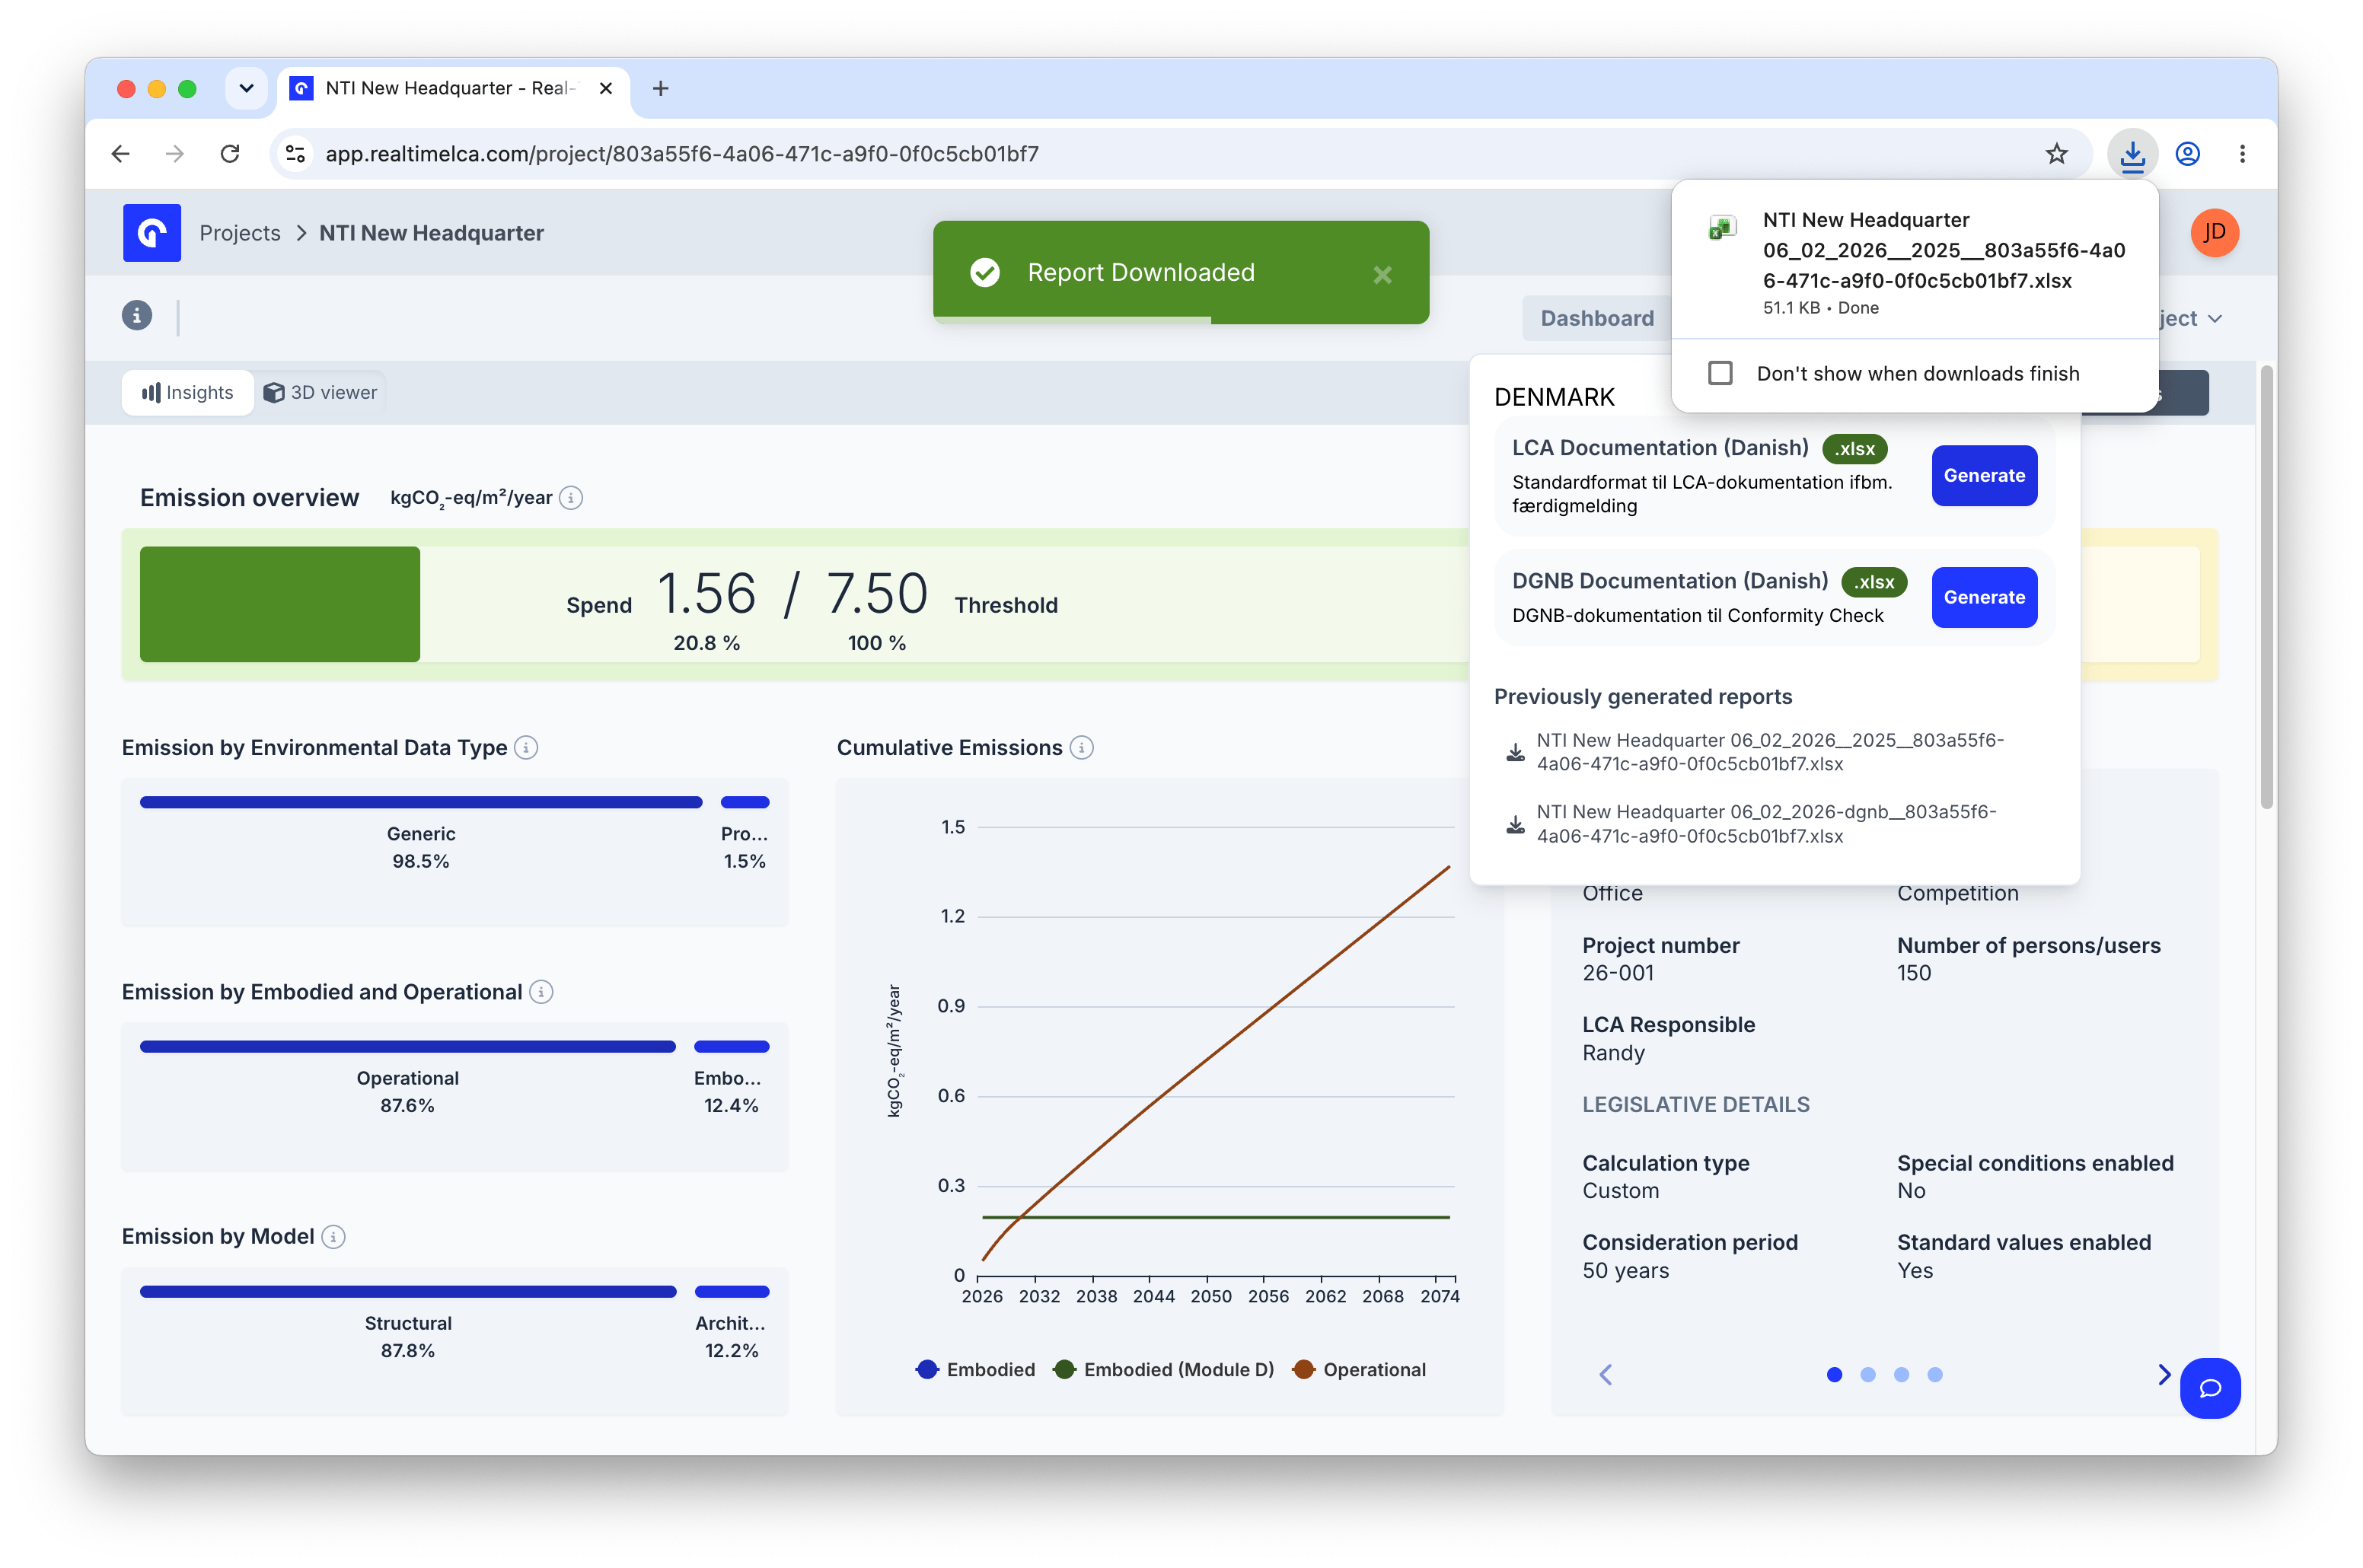
Download as Excel
.xlsx file. Use this for an ad-hoc snapshot when you don’t need a full framework report.
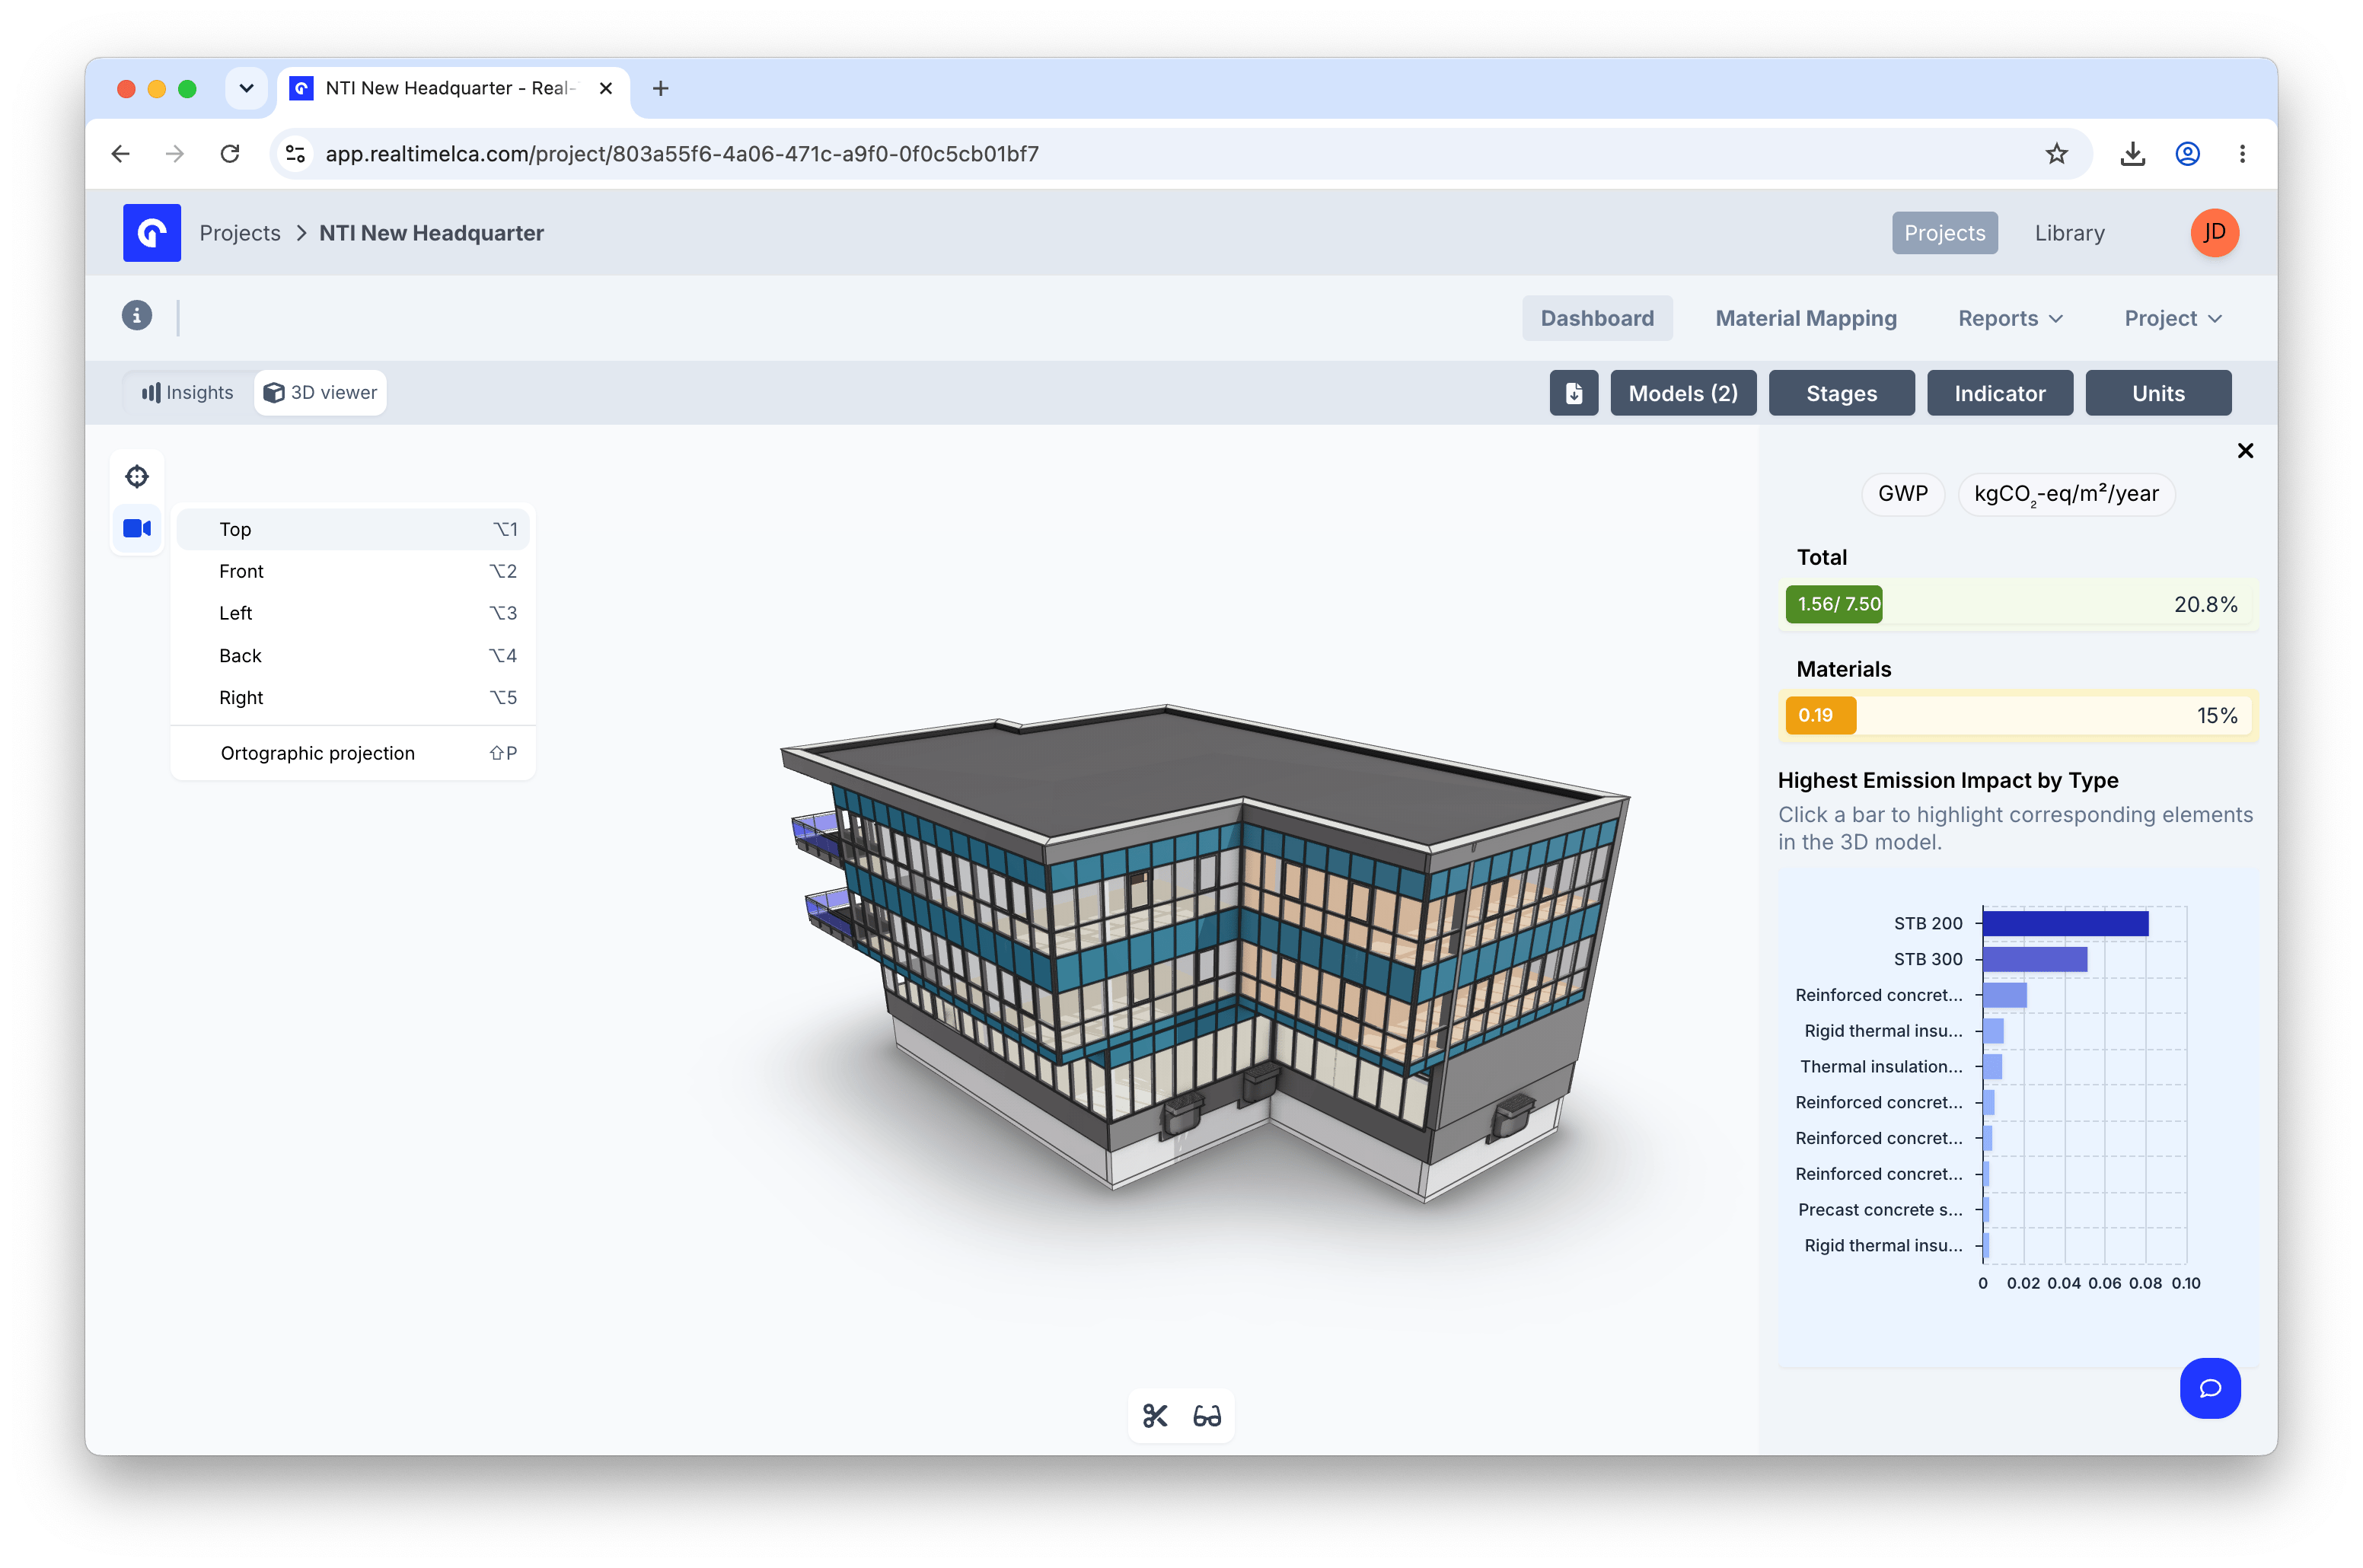
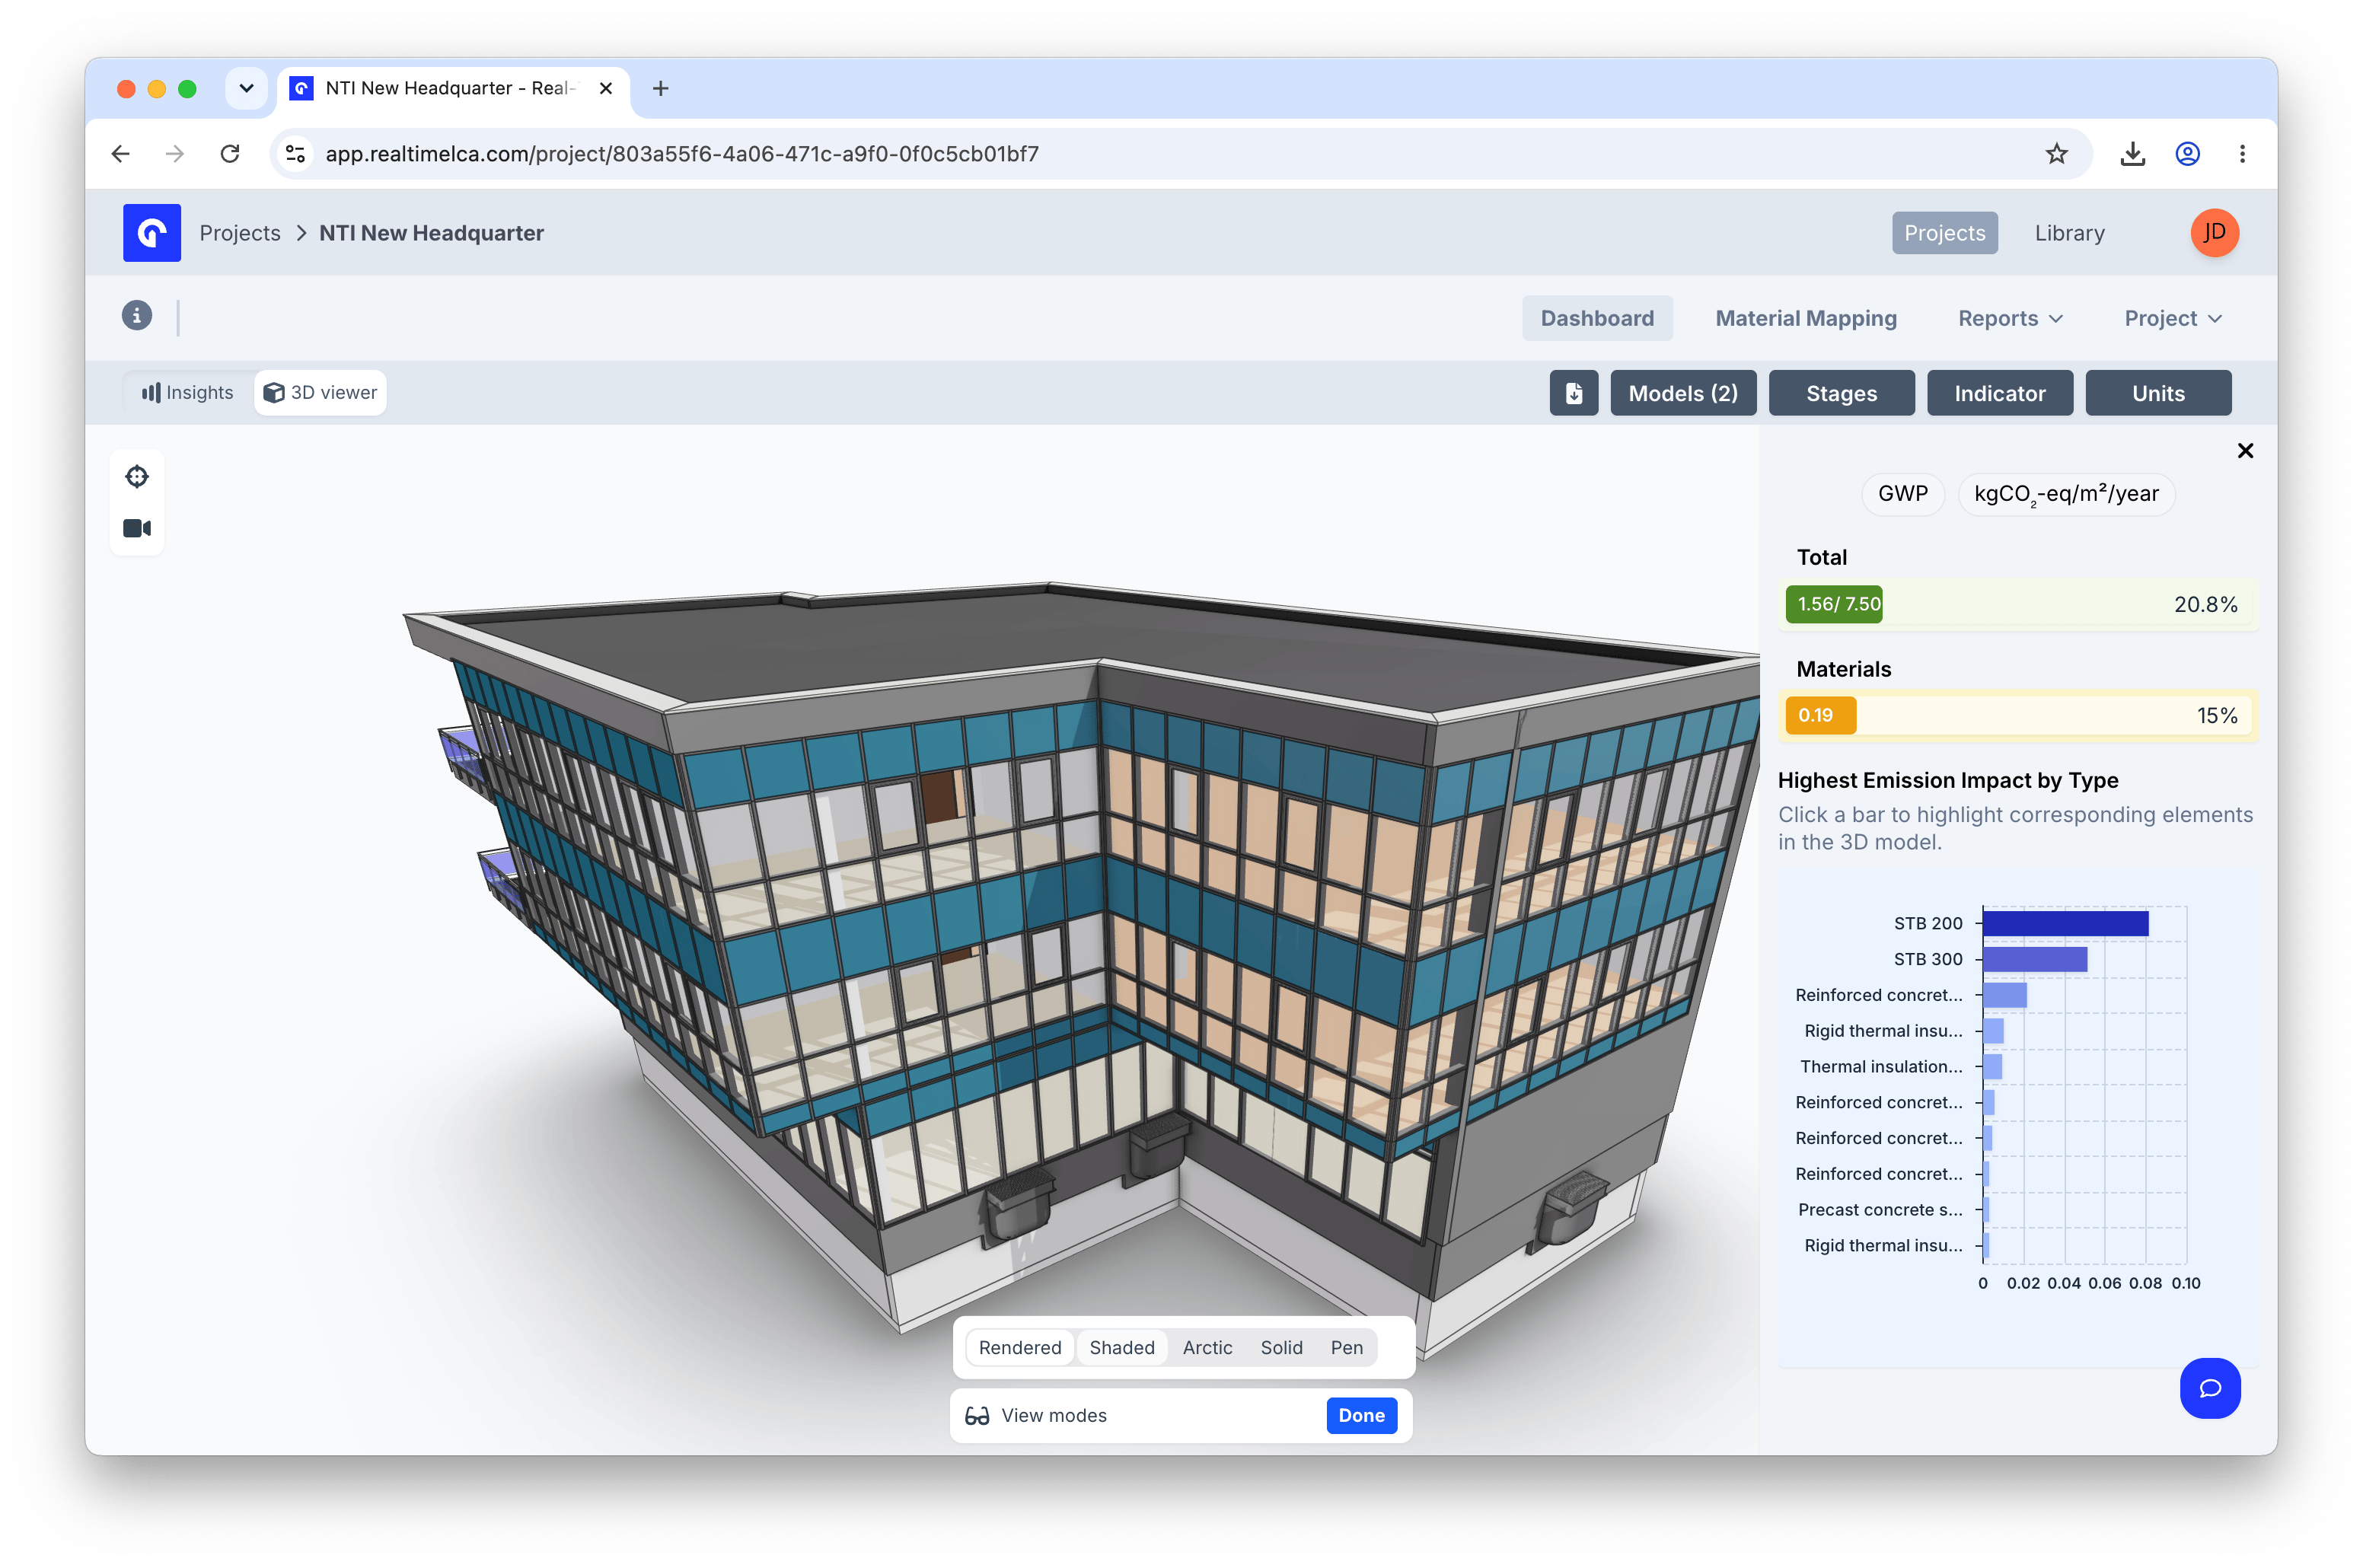
3D viewer
Toggle 3D viewer in the top-left of the dashboard to swap the Insights charts for the building model. Use the mouse to orbit, pan, and zoom; the two icons under the canvas open the section and camera presets tools.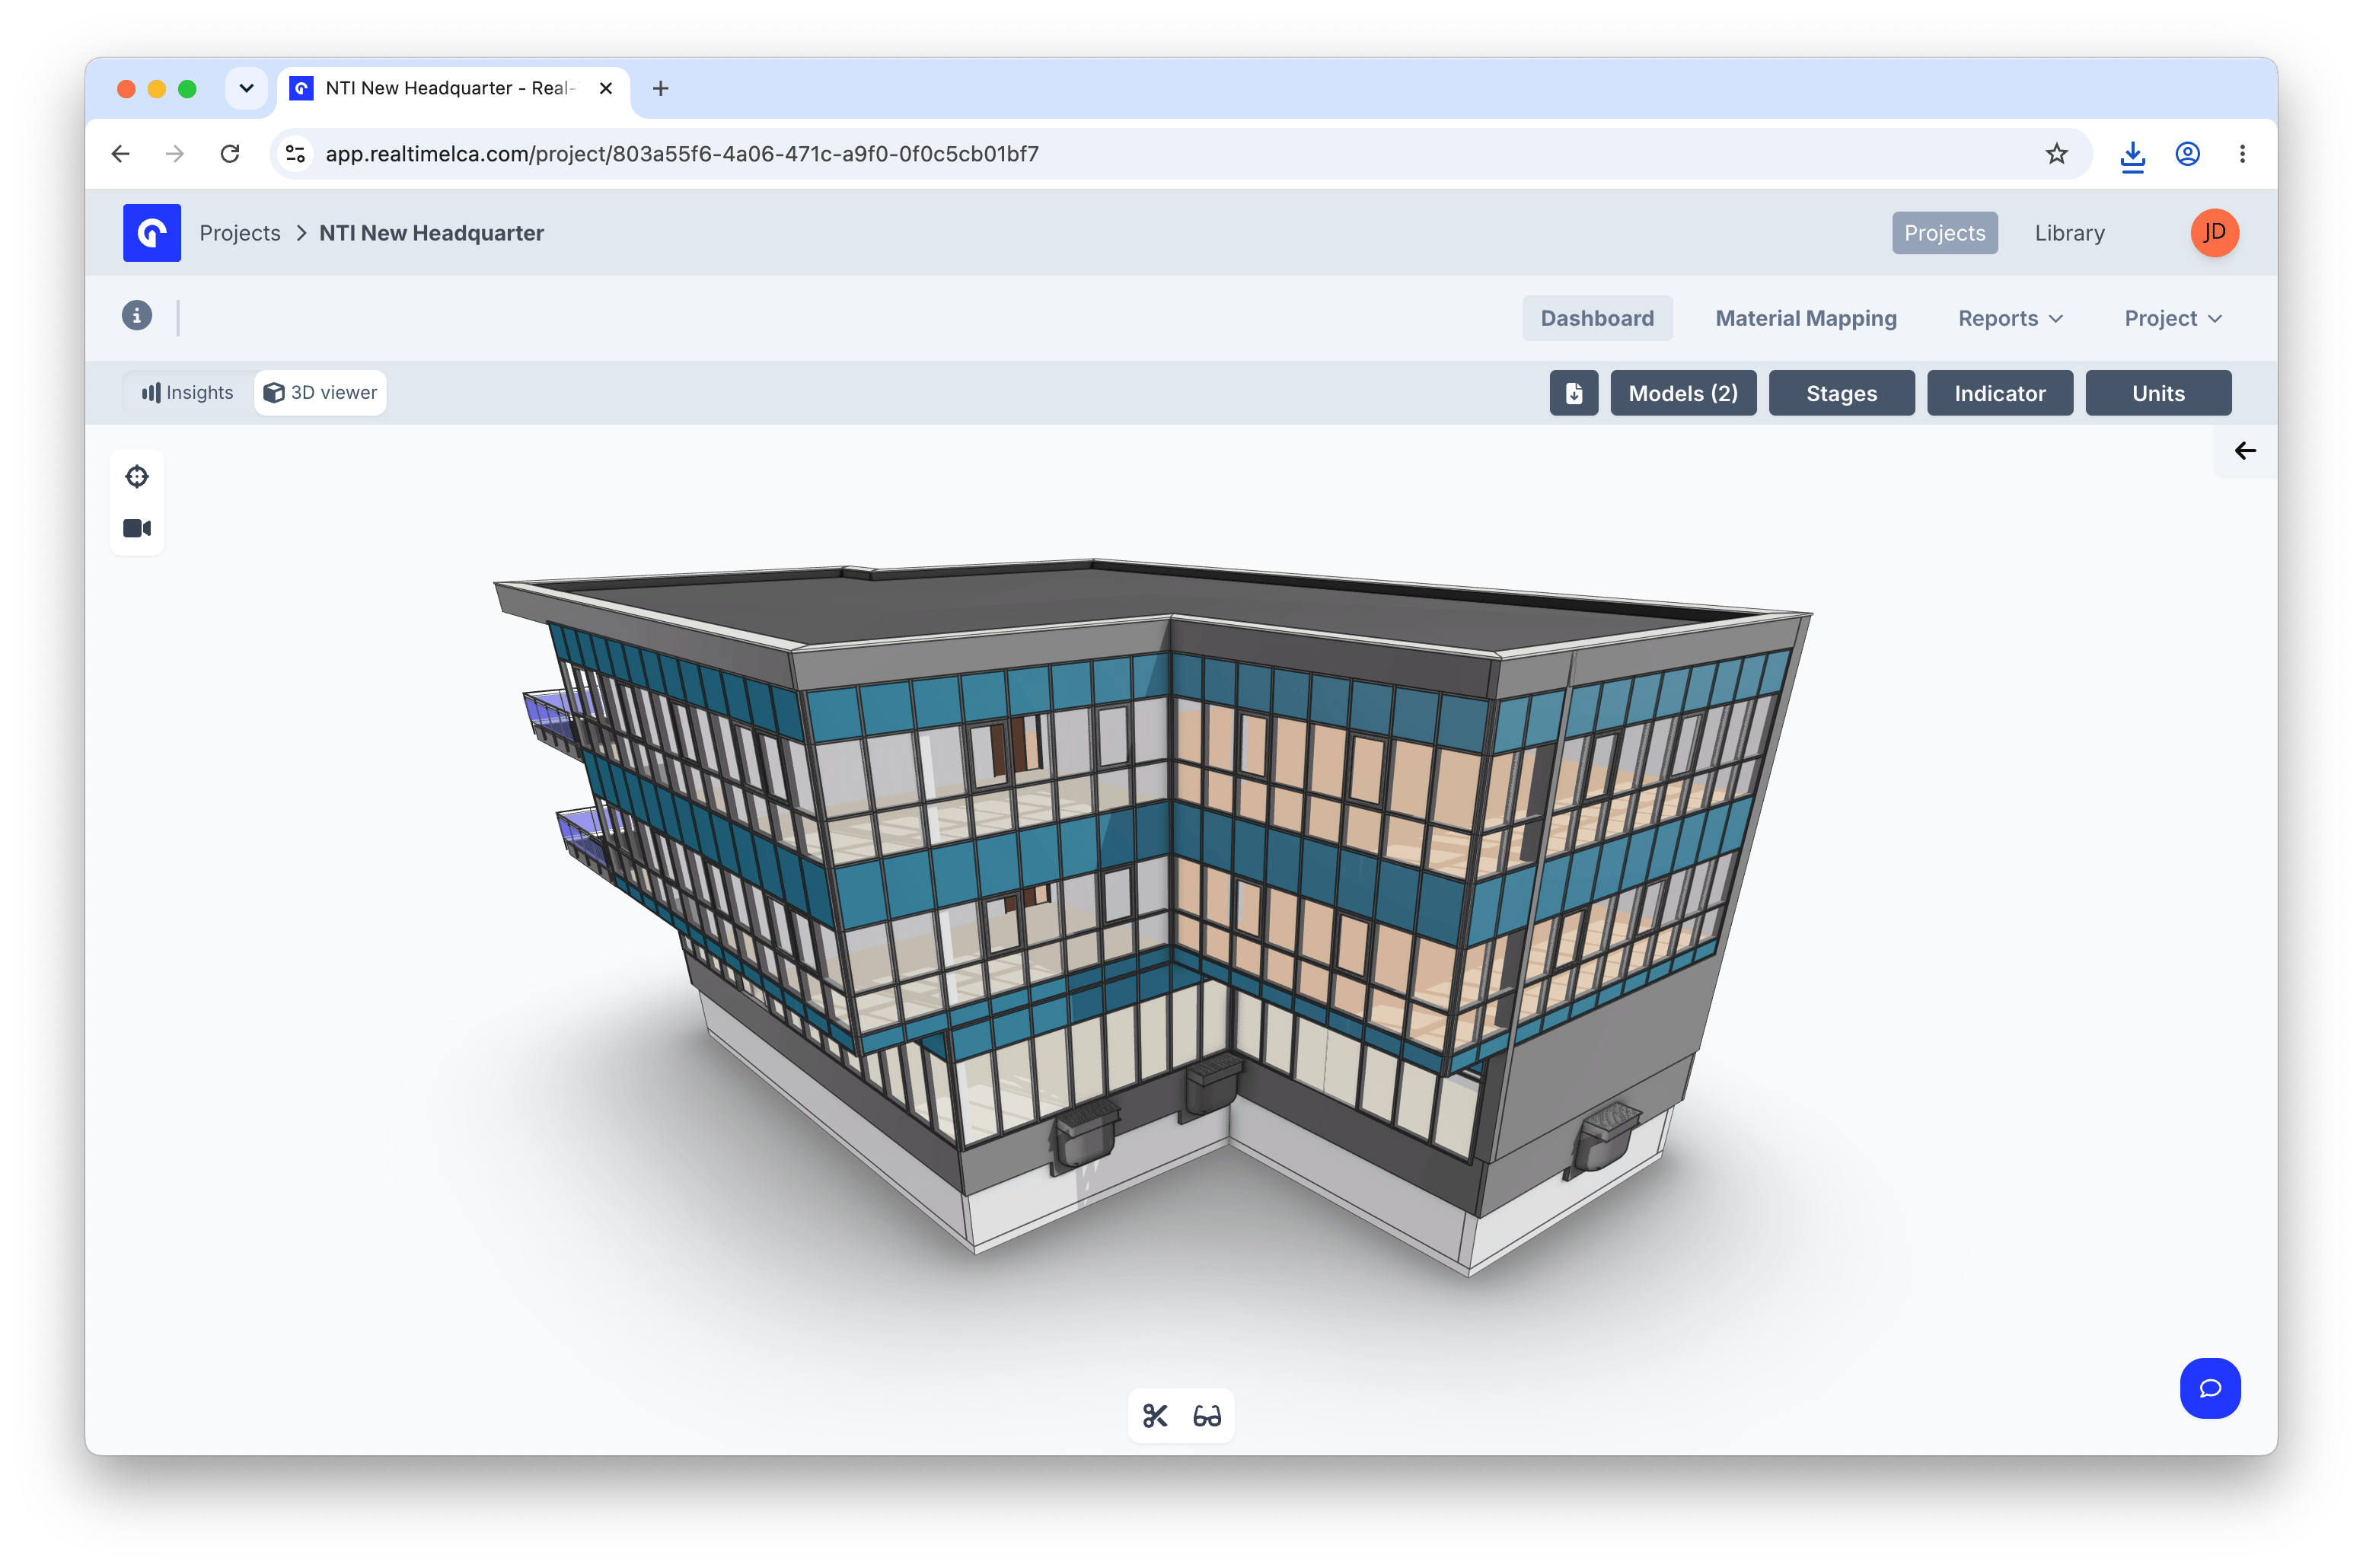
Insights panel
Filter the model from a chart
Camera presets
View modes
Section tool