> ## Documentation Index
> Fetch the complete documentation index at: https://docs.realtimelca.com/llms.txt
> Use this file to discover all available pages before exploring further.
# Project Dashboard
> The hub for a single project — emissions, mapping, models, reports, and project-level actions.
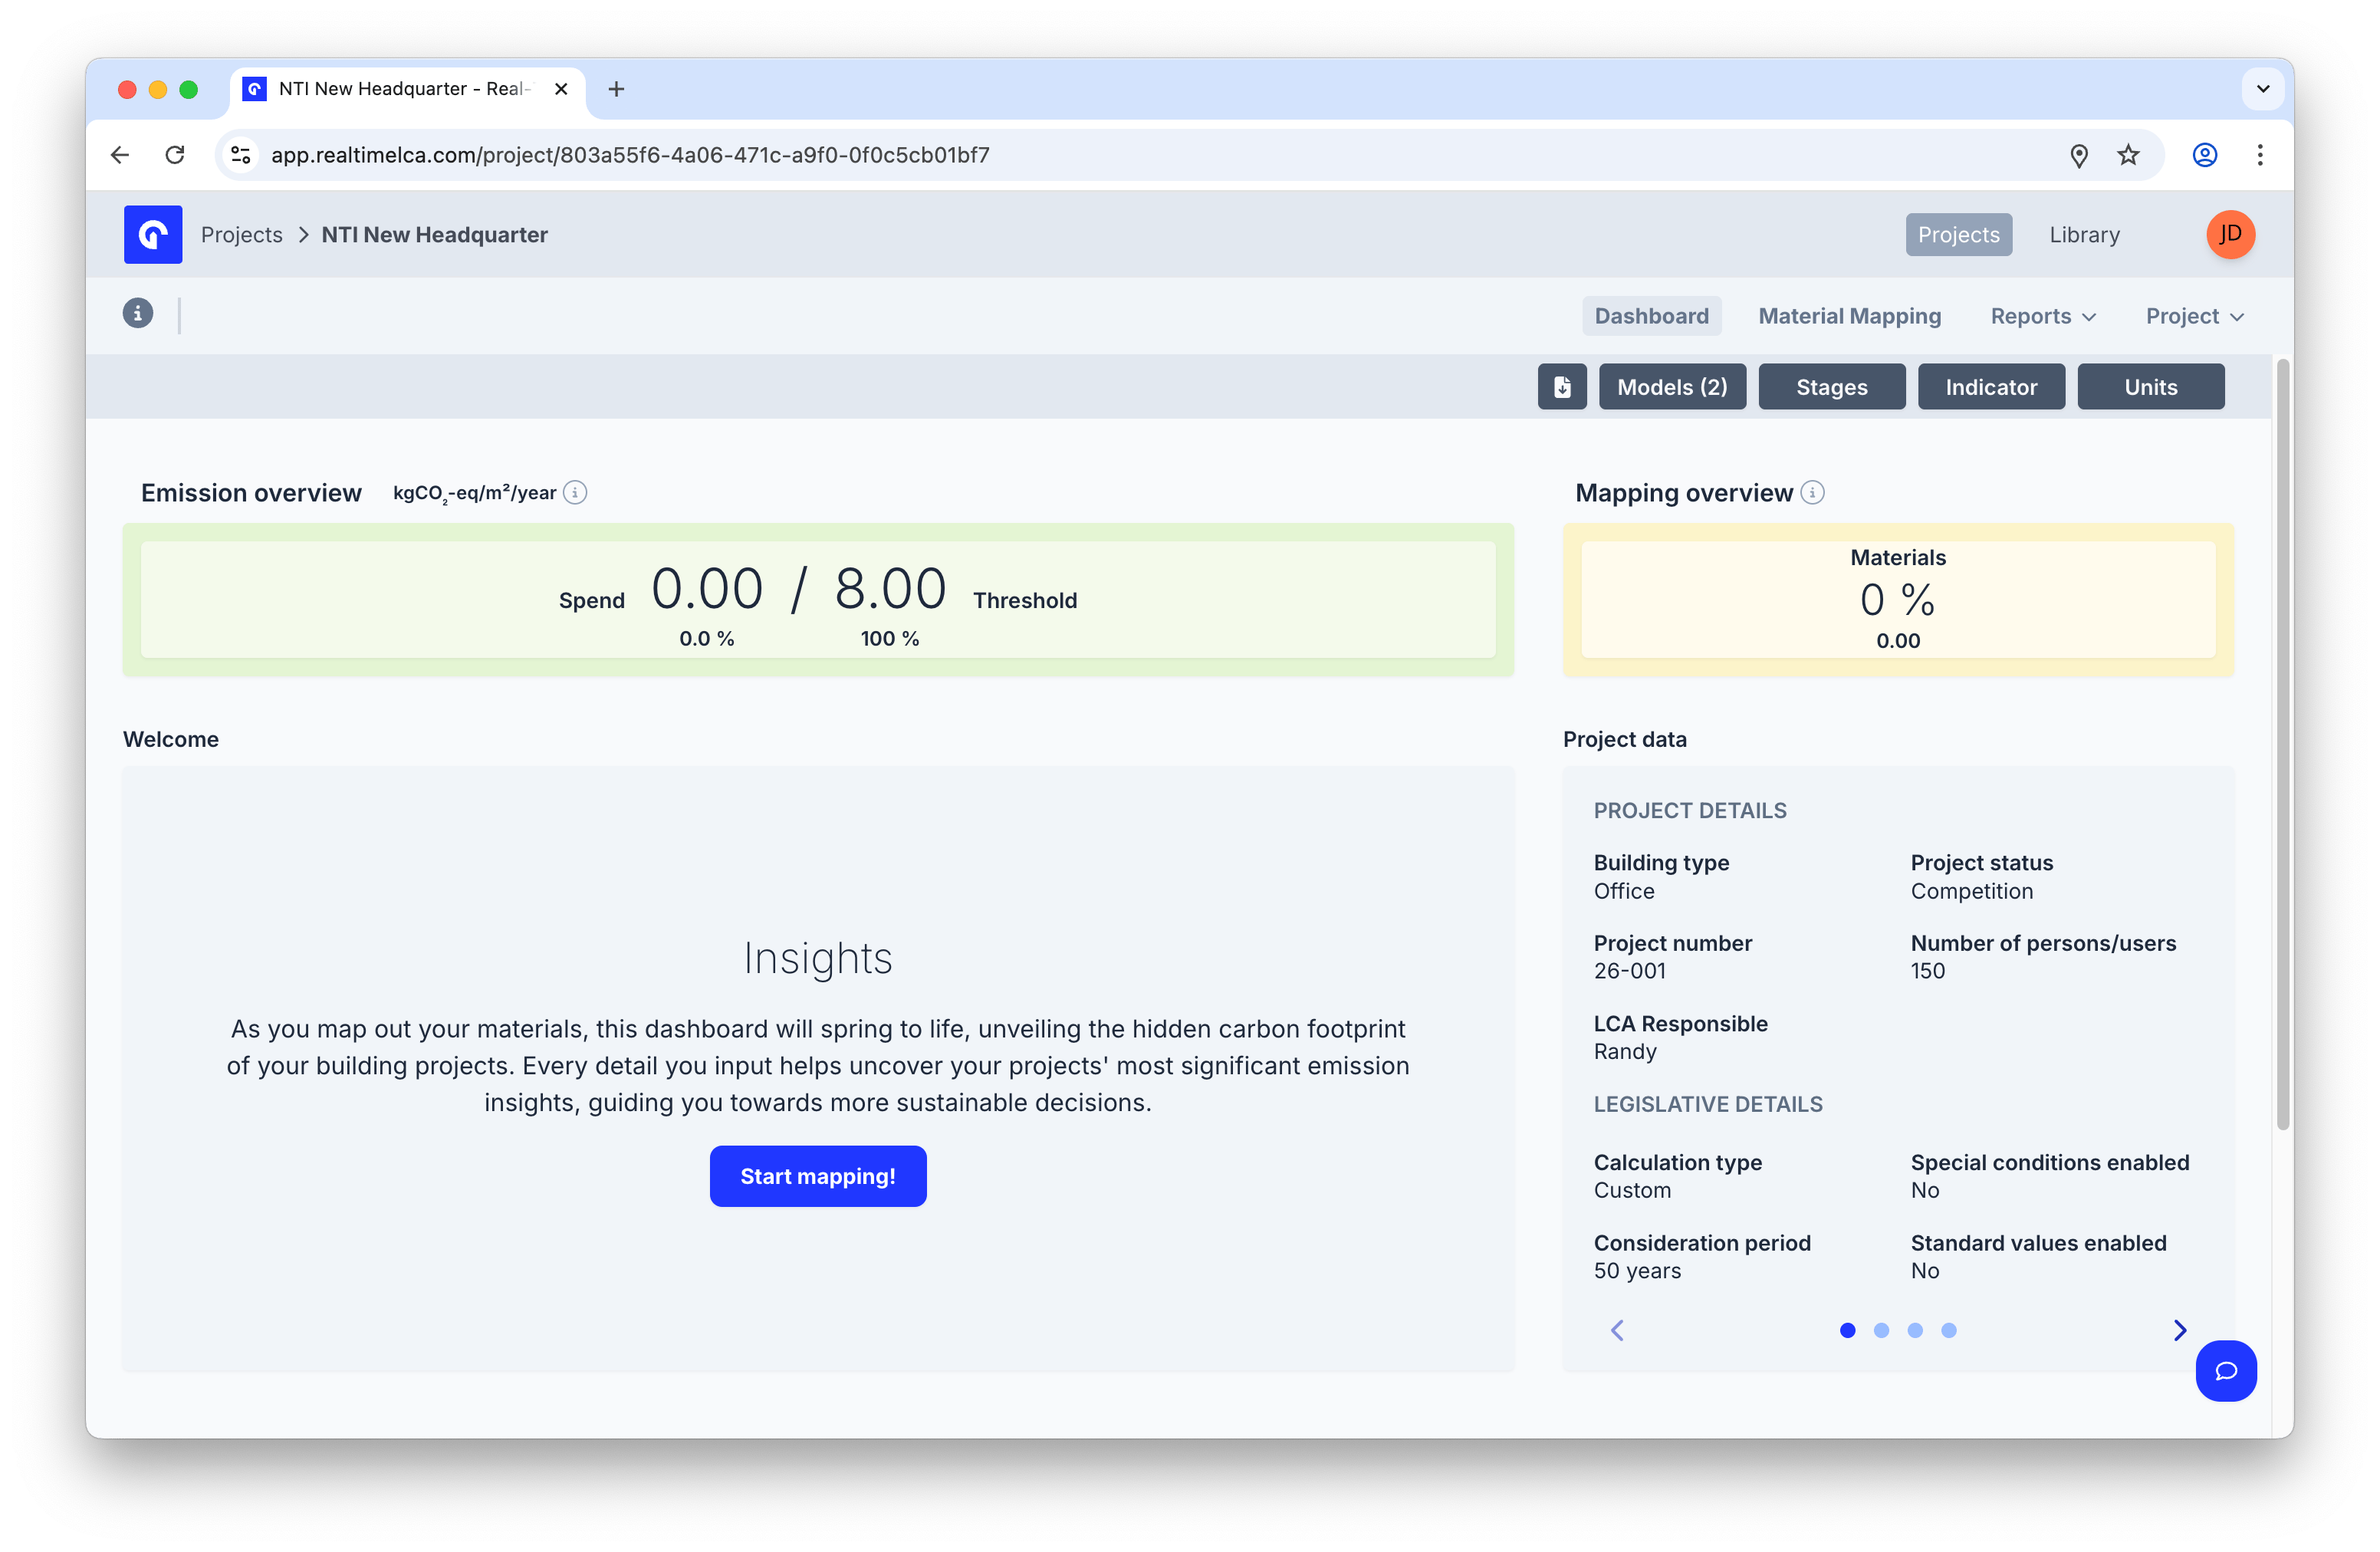
The **Project Dashboard** is what you see after opening a project from the [Project Overview](/user-guide/project/project-overview). It surfaces the project's emissions and mapping status alongside the legislative and structural details that drive the calculation.
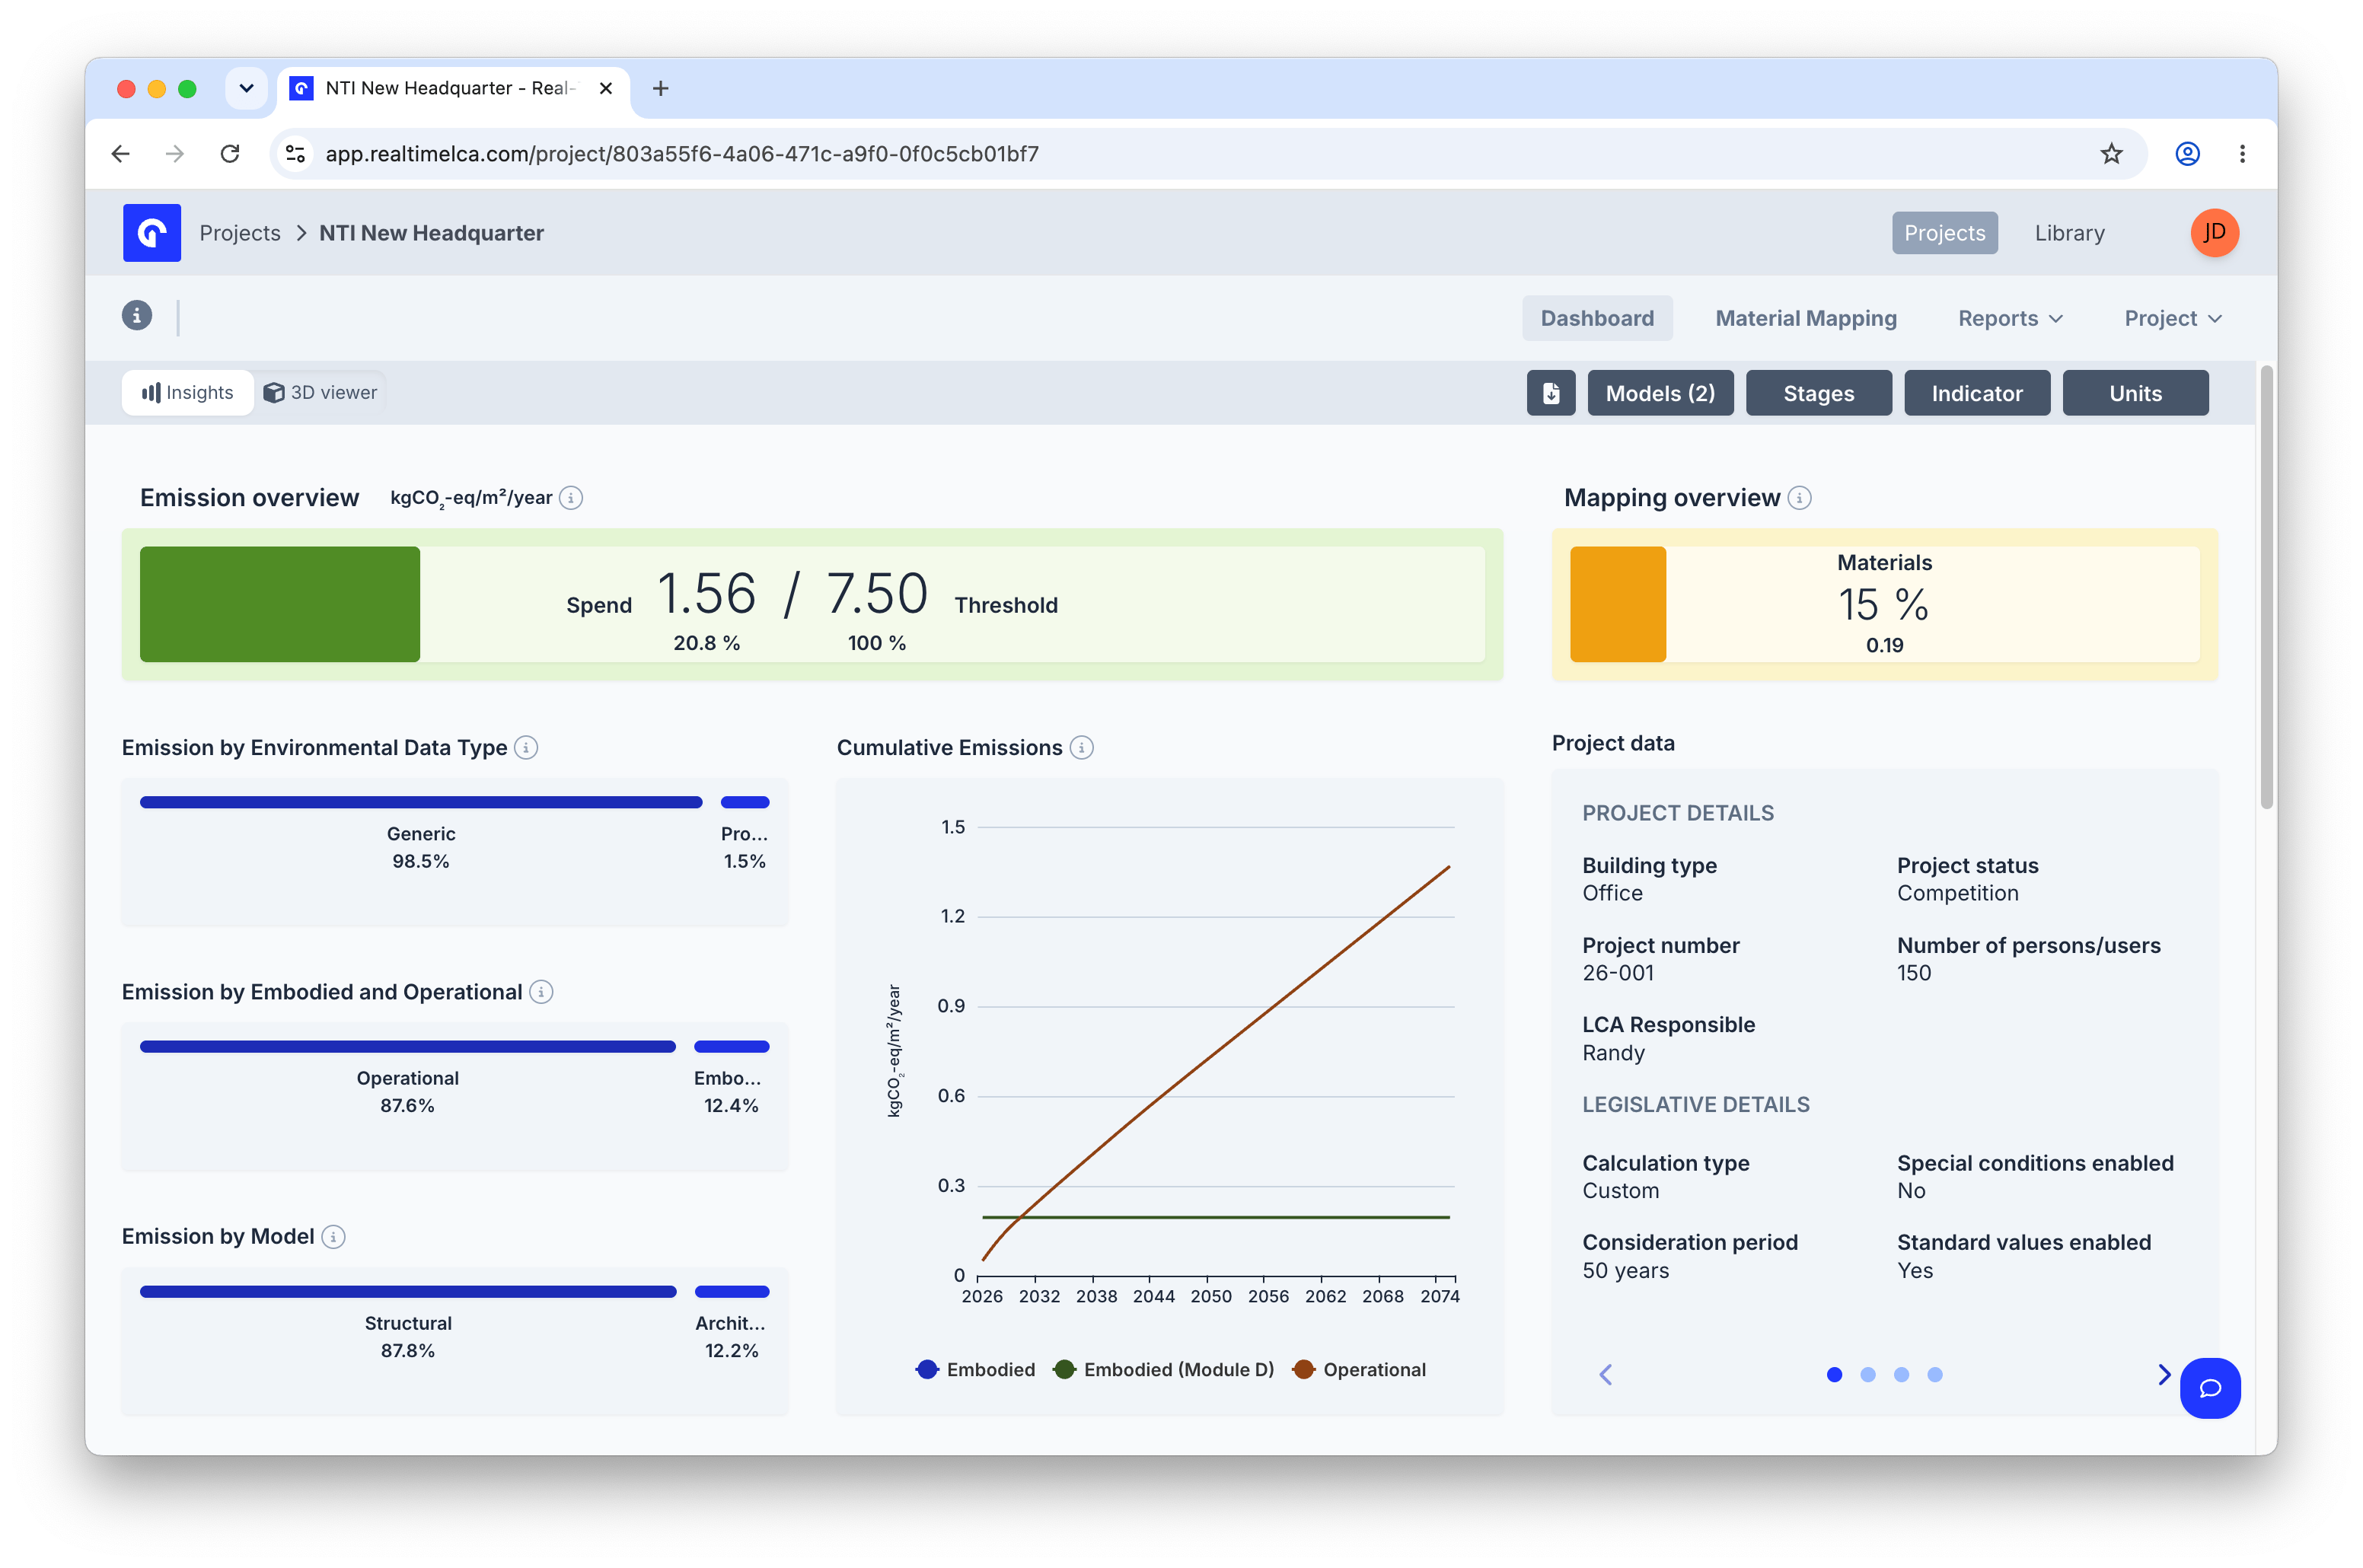
The default landing is the **Insights** view: **Emission overview** and **Mapping overview** indicators at the top, the emission breakdown charts in the middle, and the **Project data** sidebar on the right. Every card respects the active filters.
 The header can show up to six tabs, depending on the project settings:
* **Dashboard** — emission and mapping overview, plus project data (the page above).
* **Material Mapping** — [map model elements to materials](/user-guide/project/material-mapping).
* **Transport Mapping** — [map transport for each material](/user-guide/project/transport-mapping). *Only visible when transport is required by the project's framework or activated in [Project Settings](/user-guide/project/project-settings).*
* **Waste Sorting** — [classify waste flows](/user-guide/project/waste-sorting). *Only visible when waste sorting is required or activated in [Project Settings](/user-guide/project/project-settings).*
* **Reports** — [generate documentation for the selected framework](#reports).
* **Project** — [project-level actions](/user-guide/project/project-settings) (Manage Users, Edit, Clone, Delete).
The dashboard itself has two views, toggled in the top-left of the page: **Insights** (the default, shown above) and **3D viewer** (the model with an emission breakdown side panel). The four filter pills in the top-right — **Models**, **Stages**, **Indicator**, and **Units** — apply to both views.
## Filters
The filters in the top-right of the dashboard scope every number and chart on the page. Selections persist while you switch between **Insights** and **3D viewer**.
### Models filter
The header can show up to six tabs, depending on the project settings:
* **Dashboard** — emission and mapping overview, plus project data (the page above).
* **Material Mapping** — [map model elements to materials](/user-guide/project/material-mapping).
* **Transport Mapping** — [map transport for each material](/user-guide/project/transport-mapping). *Only visible when transport is required by the project's framework or activated in [Project Settings](/user-guide/project/project-settings).*
* **Waste Sorting** — [classify waste flows](/user-guide/project/waste-sorting). *Only visible when waste sorting is required or activated in [Project Settings](/user-guide/project/project-settings).*
* **Reports** — [generate documentation for the selected framework](#reports).
* **Project** — [project-level actions](/user-guide/project/project-settings) (Manage Users, Edit, Clone, Delete).
The dashboard itself has two views, toggled in the top-left of the page: **Insights** (the default, shown above) and **3D viewer** (the model with an emission breakdown side panel). The four filter pills in the top-right — **Models**, **Stages**, **Indicator**, and **Units** — apply to both views.
## Filters
The filters in the top-right of the dashboard scope every number and chart on the page. Selections persist while you switch between **Insights** and **3D viewer**.
### Models filter
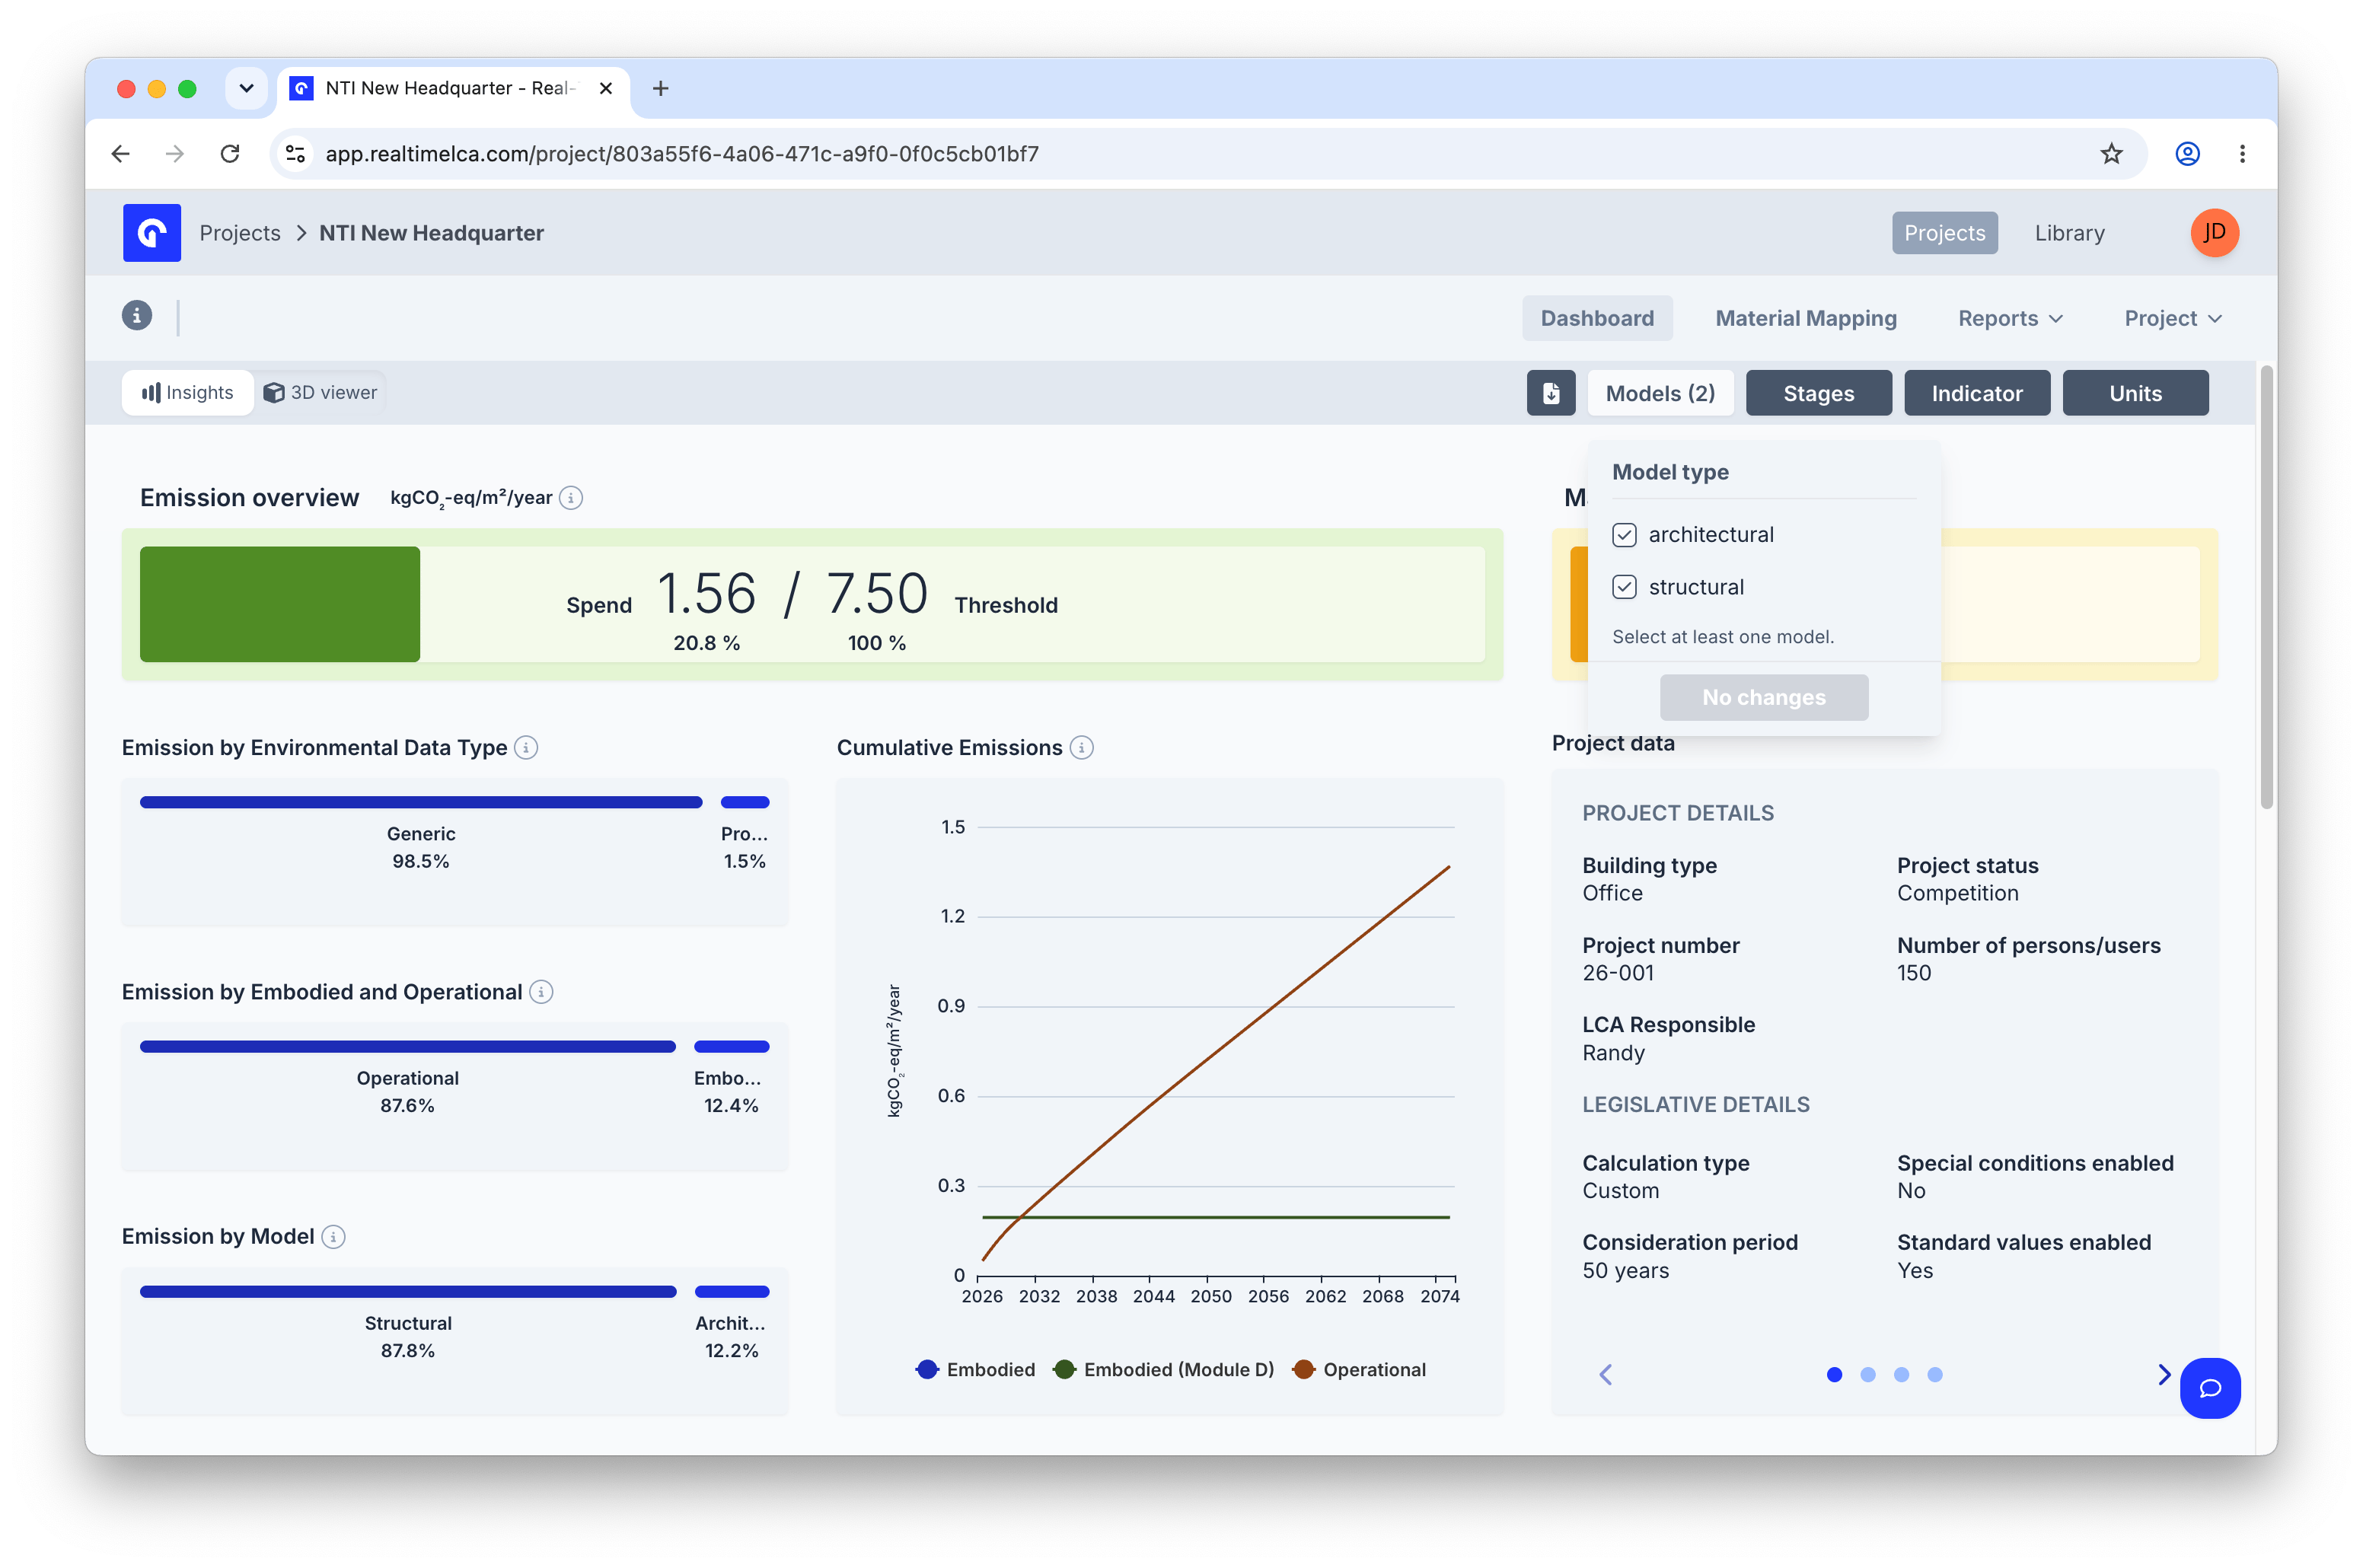 Pick which model types contribute to the calculation. At least one must remain selected — the **No changes** button is disabled until a change is made. The pill shows the number of active models, e.g. **Models (2)**.
### Stages filter
Pick which model types contribute to the calculation. At least one must remain selected — the **No changes** button is disabled until a change is made. The pill shows the number of active models, e.g. **Models (2)**.
### Stages filter
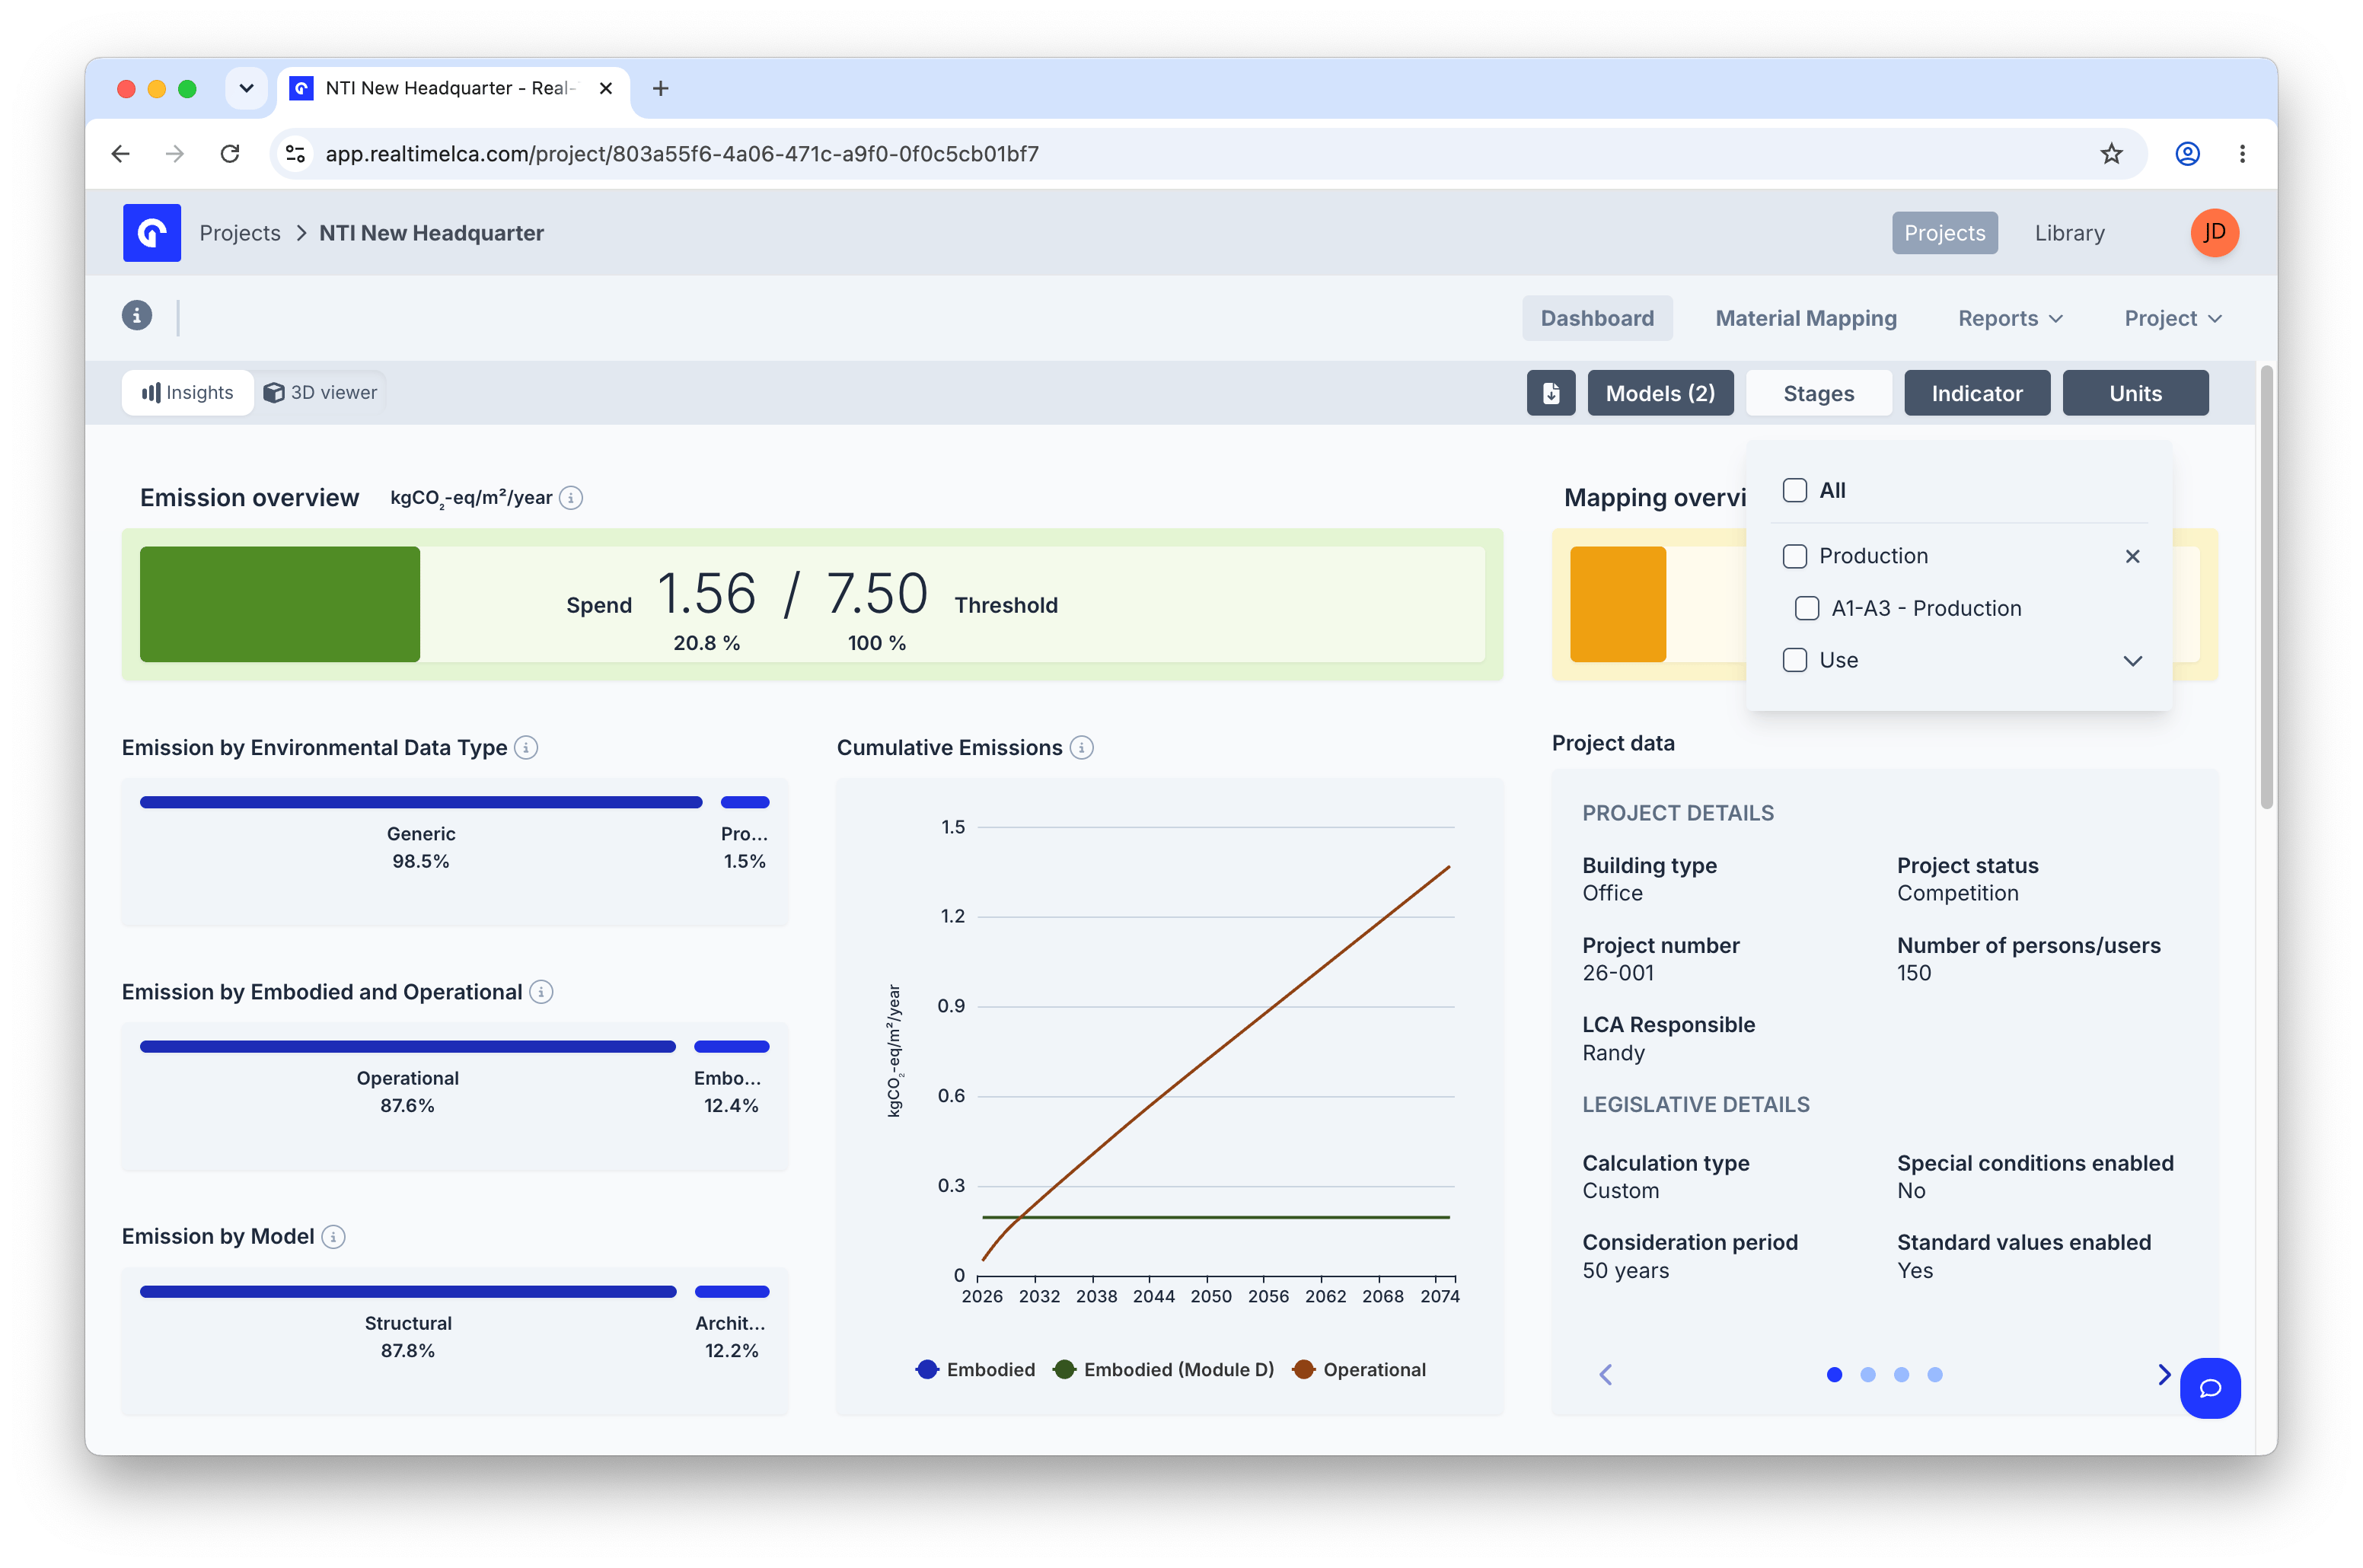 Choose which lifecycle stage groups are included — **All**, **Production**, **A1–A3 — Production**, or **Use**. Each group expands to the underlying modules from your calculation method.
### Indicator filter
Choose which lifecycle stage groups are included — **All**, **Production**, **A1–A3 — Production**, or **Use**. Each group expands to the underlying modules from your calculation method.
### Indicator filter
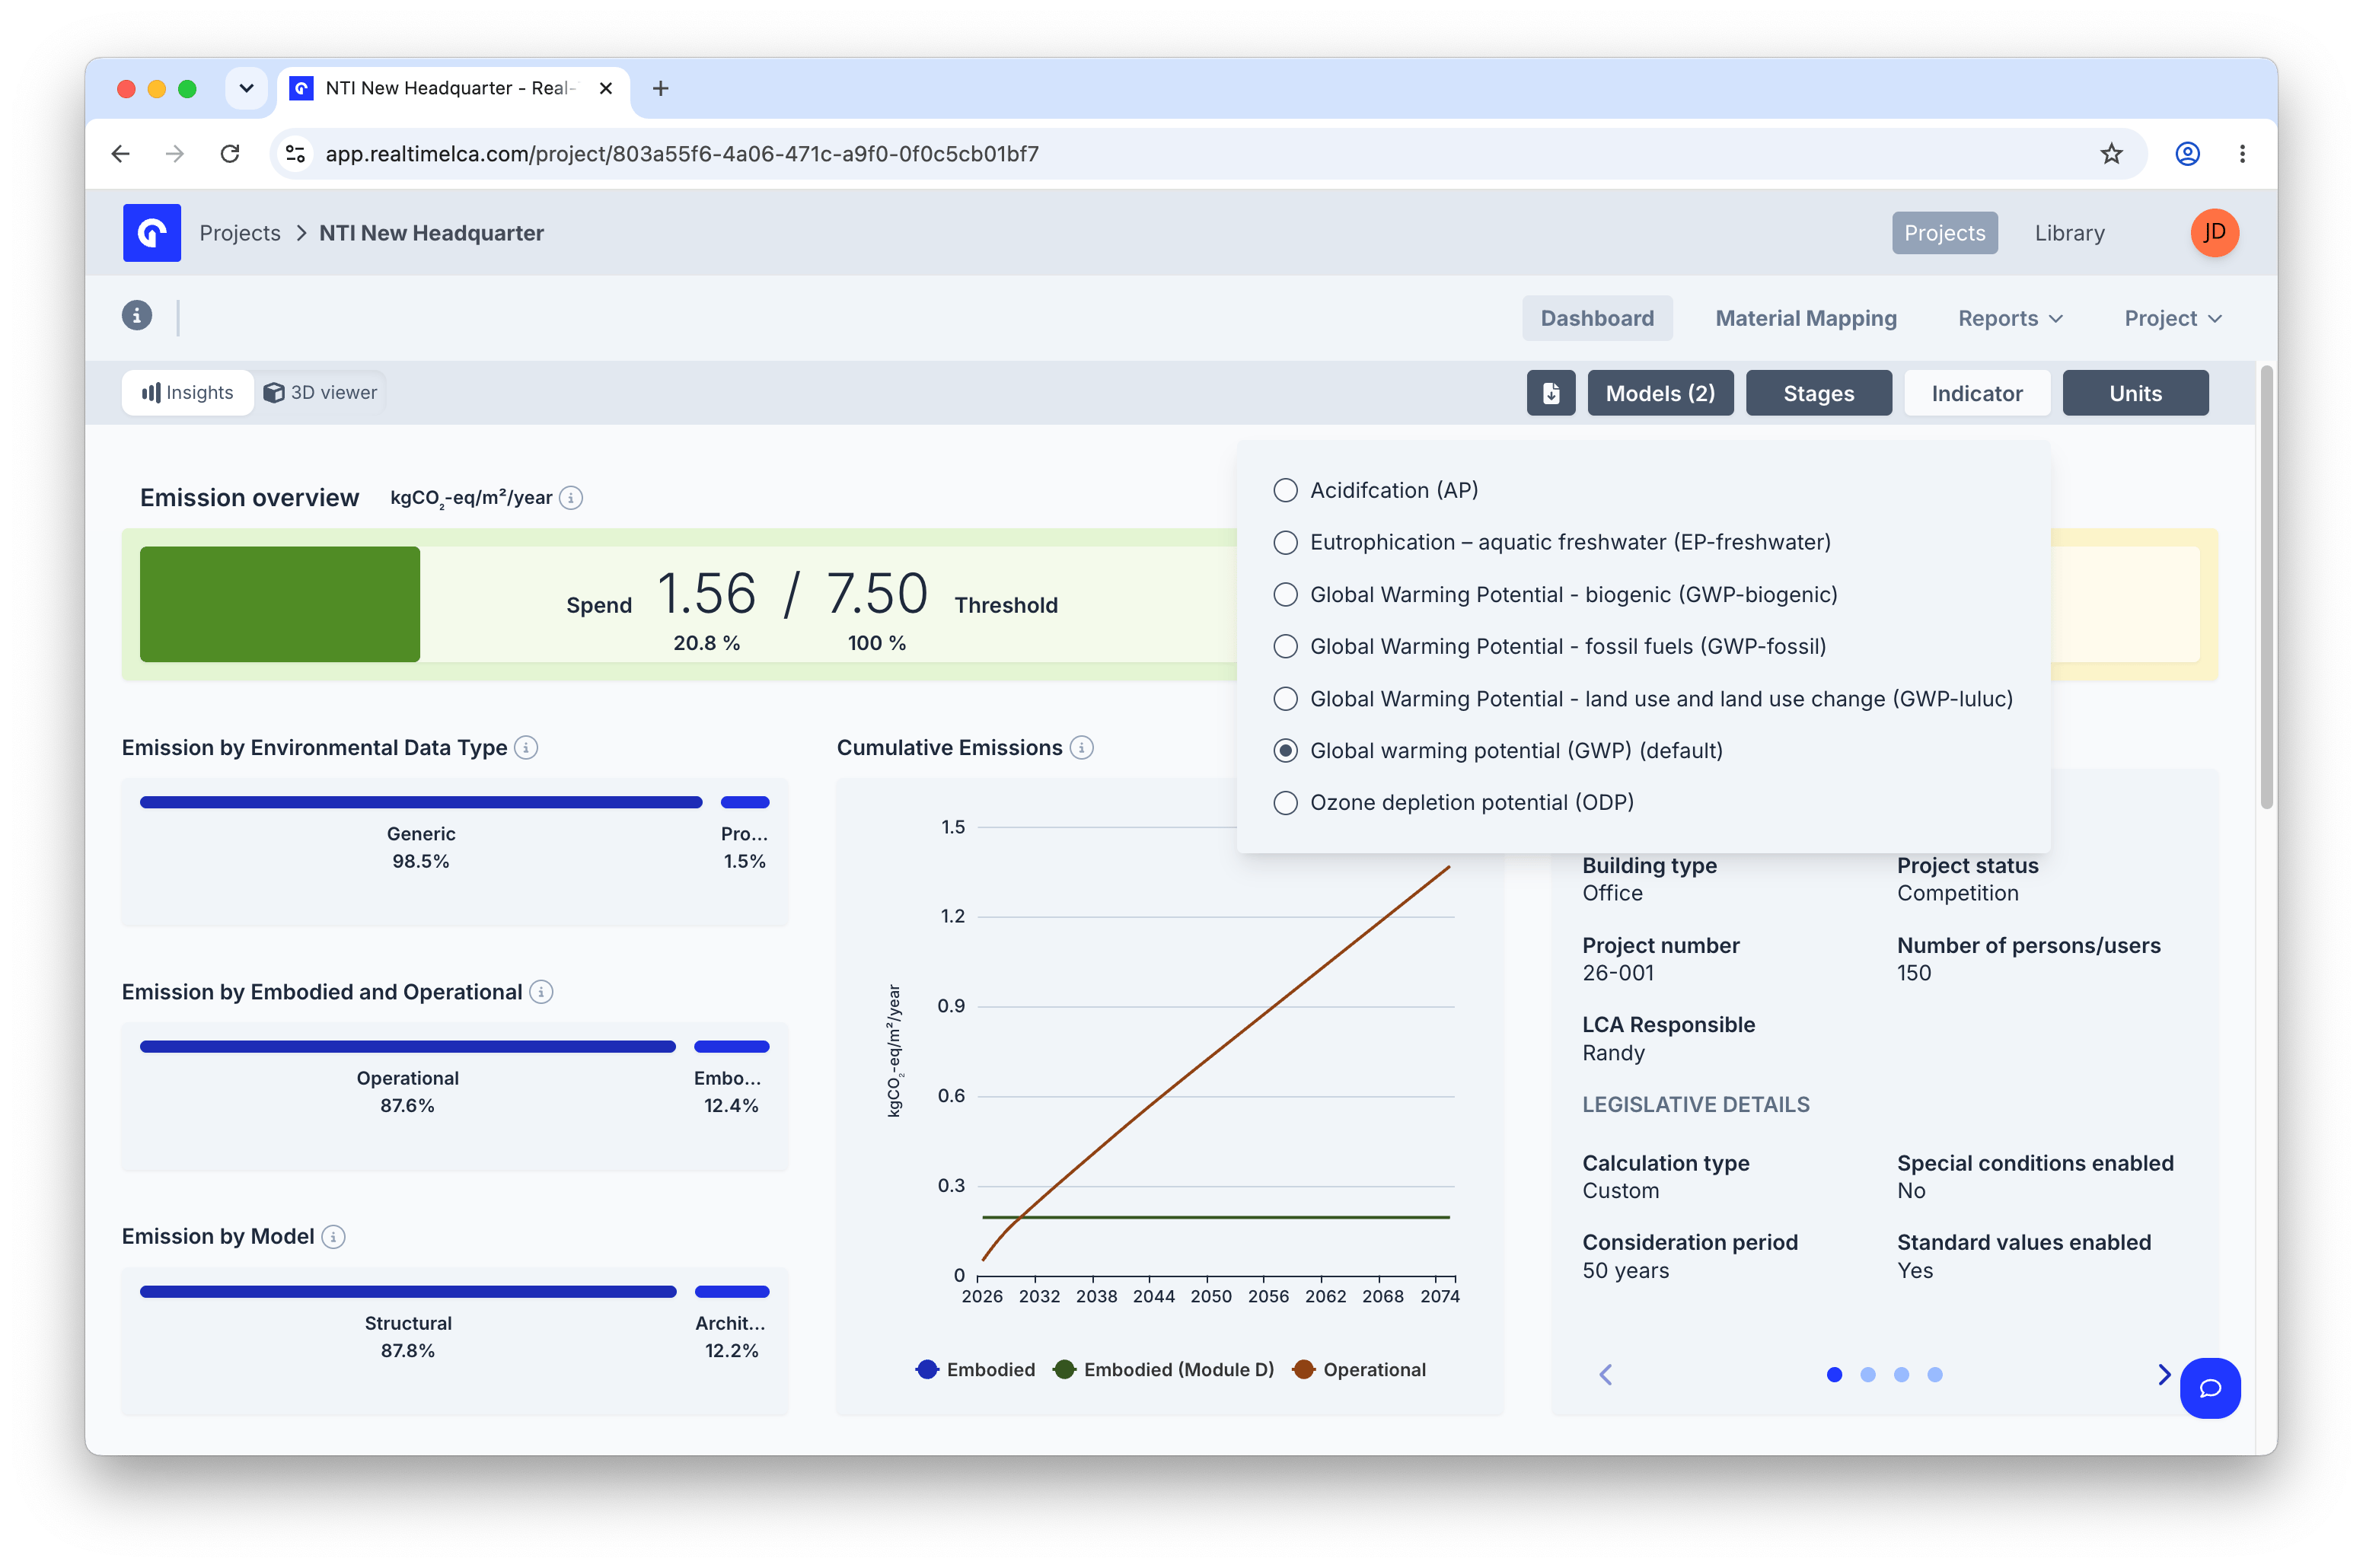 Switch the environmental indicator used across the dashboard. **Global warming potential (GWP) — default** is selected out of the box; other options include the GWP sub-indicators (biogenic, fossil, luluc), **Acidification (AP)**, **Eutrophication (EP-freshwater)**, and **Ozone depletion (ODP)**.
### Units filter
Switch the environmental indicator used across the dashboard. **Global warming potential (GWP) — default** is selected out of the box; other options include the GWP sub-indicators (biogenic, fossil, luluc), **Acidification (AP)**, **Eutrophication (EP-freshwater)**, and **Ozone depletion (ODP)**.
### Units filter
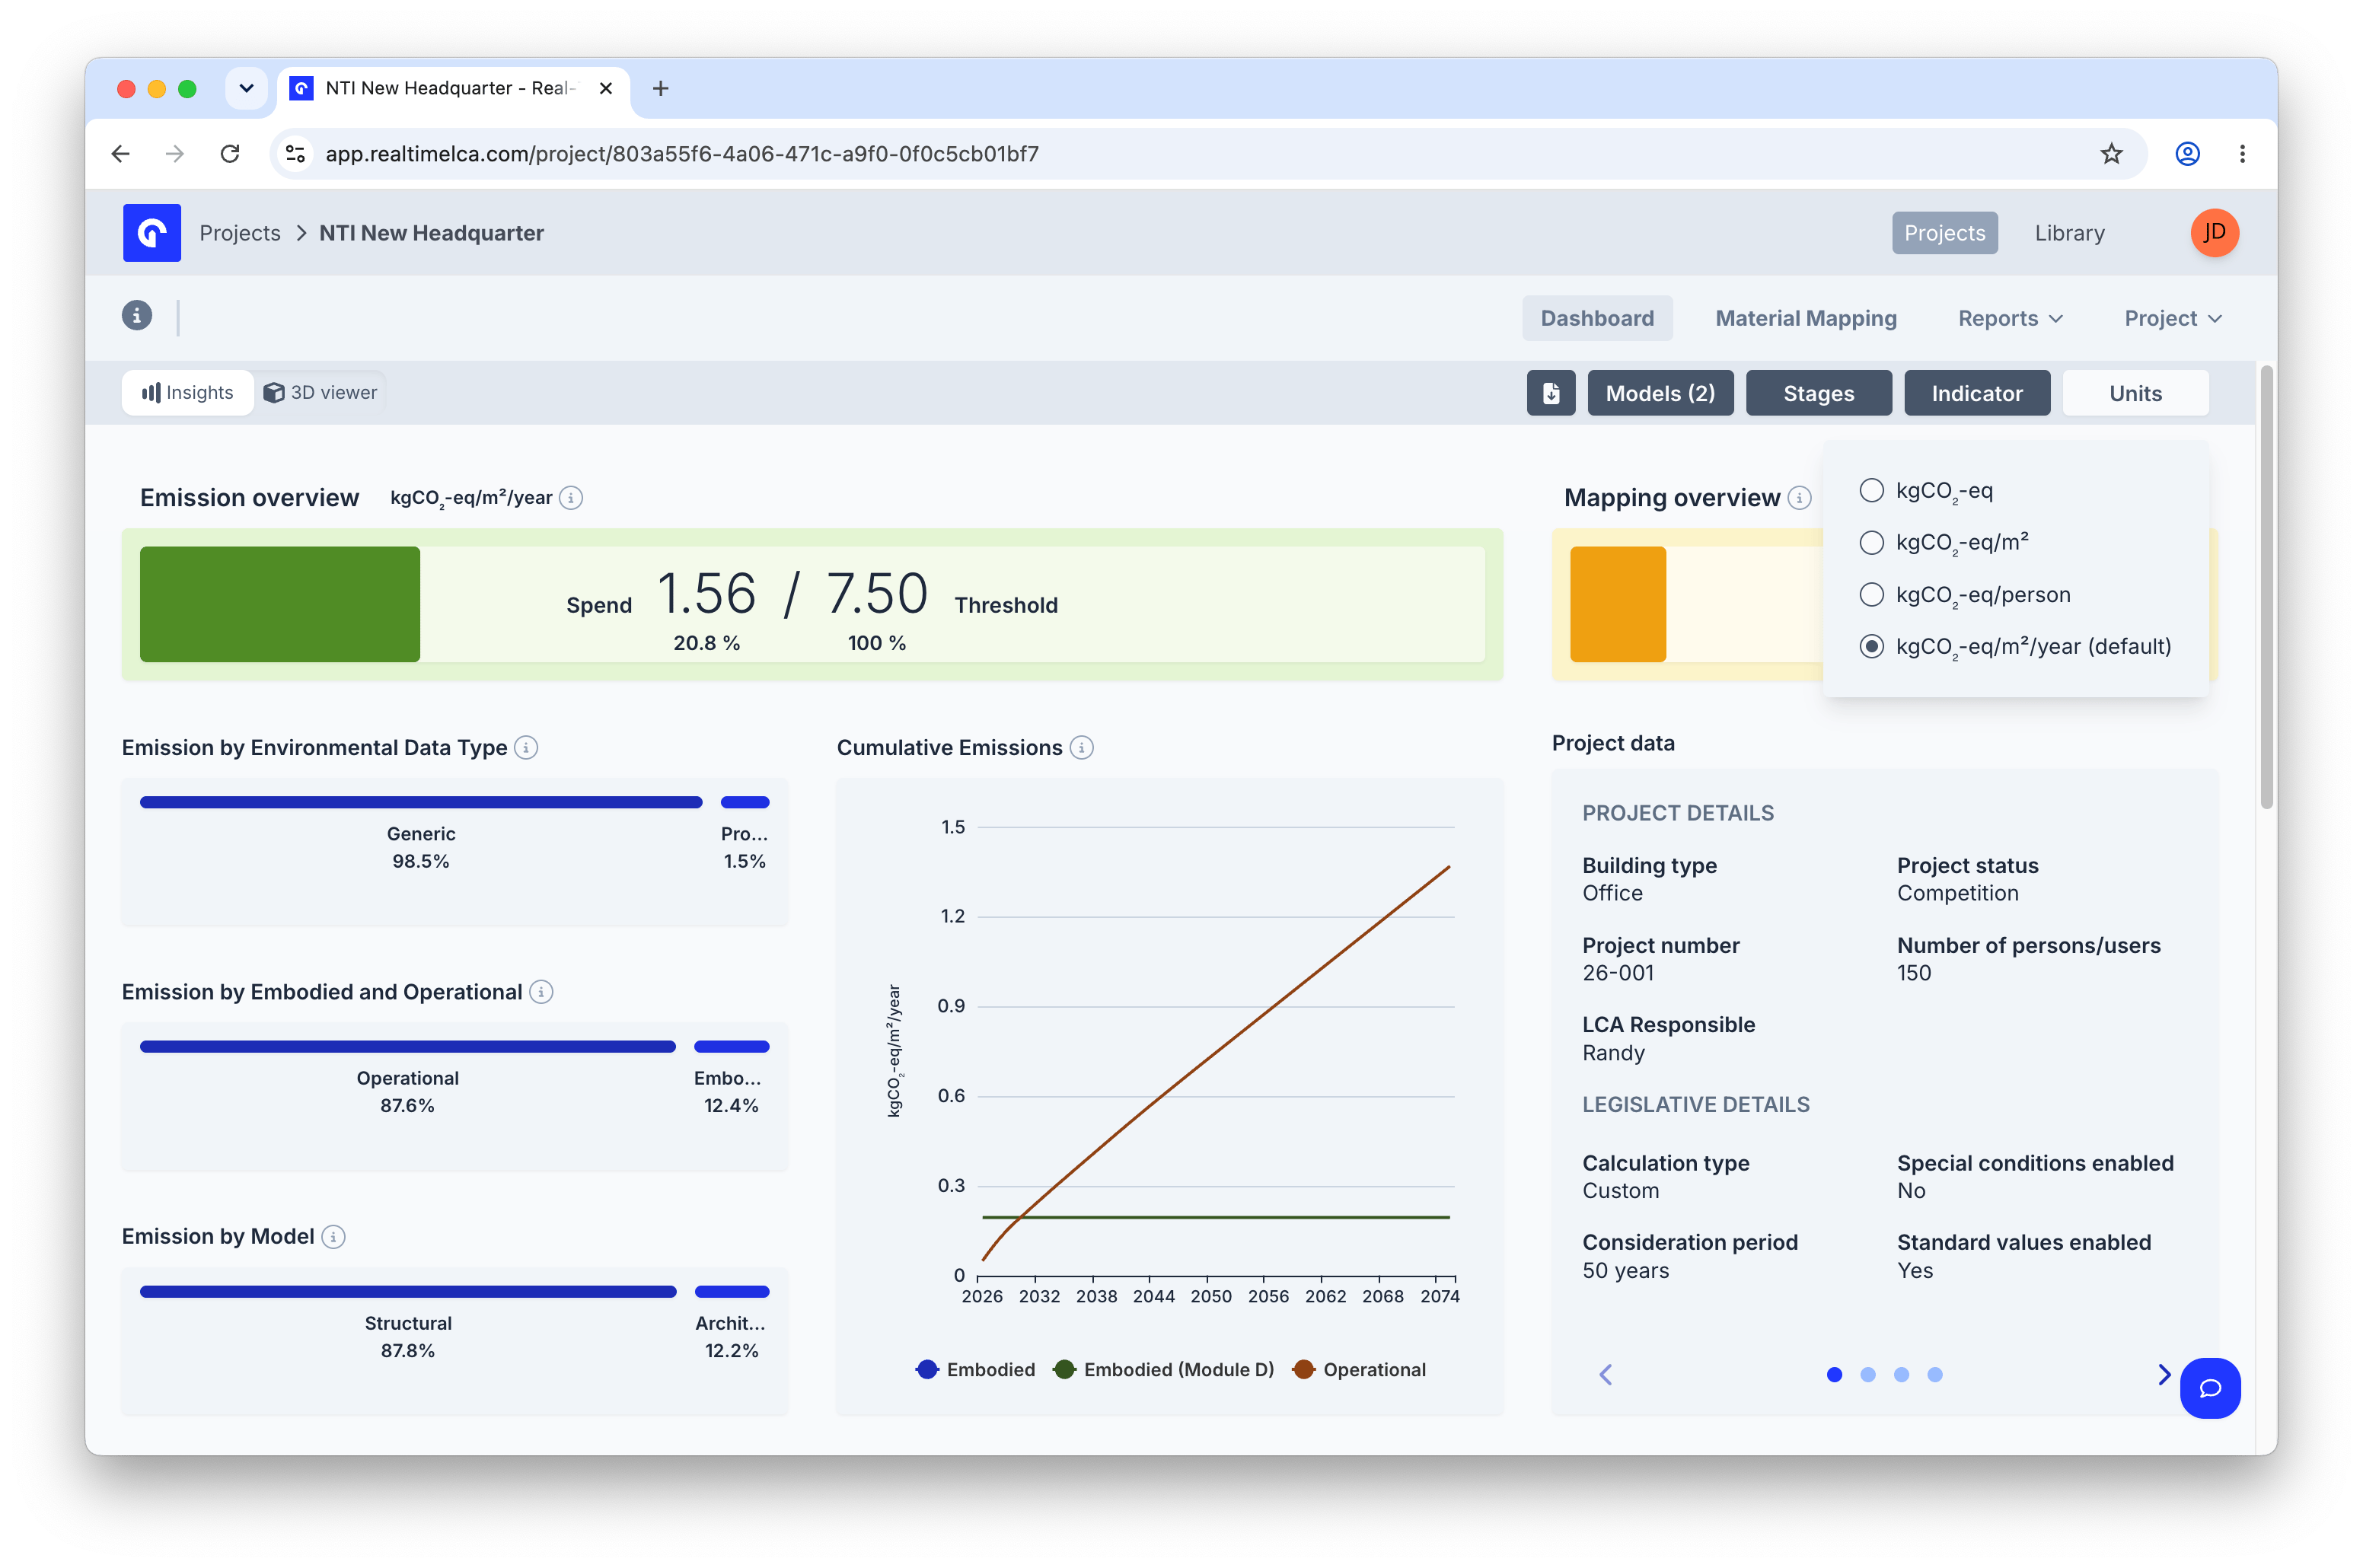 Pick the unit the numbers are normalised to: absolute (**kgCO₂-eq**), per area (**kgCO₂-eq/m²**), per person (**kgCO₂-eq/person**), or per area per year (**kgCO₂-eq/m²/year**, the default used by most frameworks).
## Emission overview
Pick the unit the numbers are normalised to: absolute (**kgCO₂-eq**), per area (**kgCO₂-eq/m²**), per person (**kgCO₂-eq/person**), or per area per year (**kgCO₂-eq/m²/year**, the default used by most frameworks).
## Emission overview
 This indicates the emissions from the modules in the calculation method. The bar colour reflects how close the project's CO₂ emissions are to the threshold limit:
* **🟩 GREEN** — at or below **90%** of the threshold. The project is comfortably within the limit.
* **🟨 YELLOW** — above **90%** and up to **95%** of the threshold. The project is close to exceeding the limit.
* **🟥 RED** — above **95%** of the threshold. The project is at or beyond the limit and needs attention.
## Mapping overview
This indicates the emissions from the modules in the calculation method. The bar colour reflects how close the project's CO₂ emissions are to the threshold limit:
* **🟩 GREEN** — at or below **90%** of the threshold. The project is comfortably within the limit.
* **🟨 YELLOW** — above **90%** and up to **95%** of the threshold. The project is close to exceeding the limit.
* **🟥 RED** — above **95%** of the threshold. The project is at or beyond the limit and needs attention.
## Mapping overview
 The mapping overview displays the percentage of materials that have been mapped in your Building Component Inventory under **Material Mapping**, as well as the progress made in **Transport Mapping**. It also presents the emissions associated with each of these mapping views.
**Material Mapping** stages **A1–A3, B4, C3, and C4**, while **Transport Mapping** includes only stage **A4**.
## Emission impact charts
The middle of the Insights view holds the emission breakdown charts. The selected **Indicator**, **Stages**, **Models**, and **Units** filters apply to all of them.
### Emission by Environmental Data Type
The mapping overview displays the percentage of materials that have been mapped in your Building Component Inventory under **Material Mapping**, as well as the progress made in **Transport Mapping**. It also presents the emissions associated with each of these mapping views.
**Material Mapping** stages **A1–A3, B4, C3, and C4**, while **Transport Mapping** includes only stage **A4**.
## Emission impact charts
The middle of the Insights view holds the emission breakdown charts. The selected **Indicator**, **Stages**, **Models**, and **Units** filters apply to all of them.
### Emission by Environmental Data Type
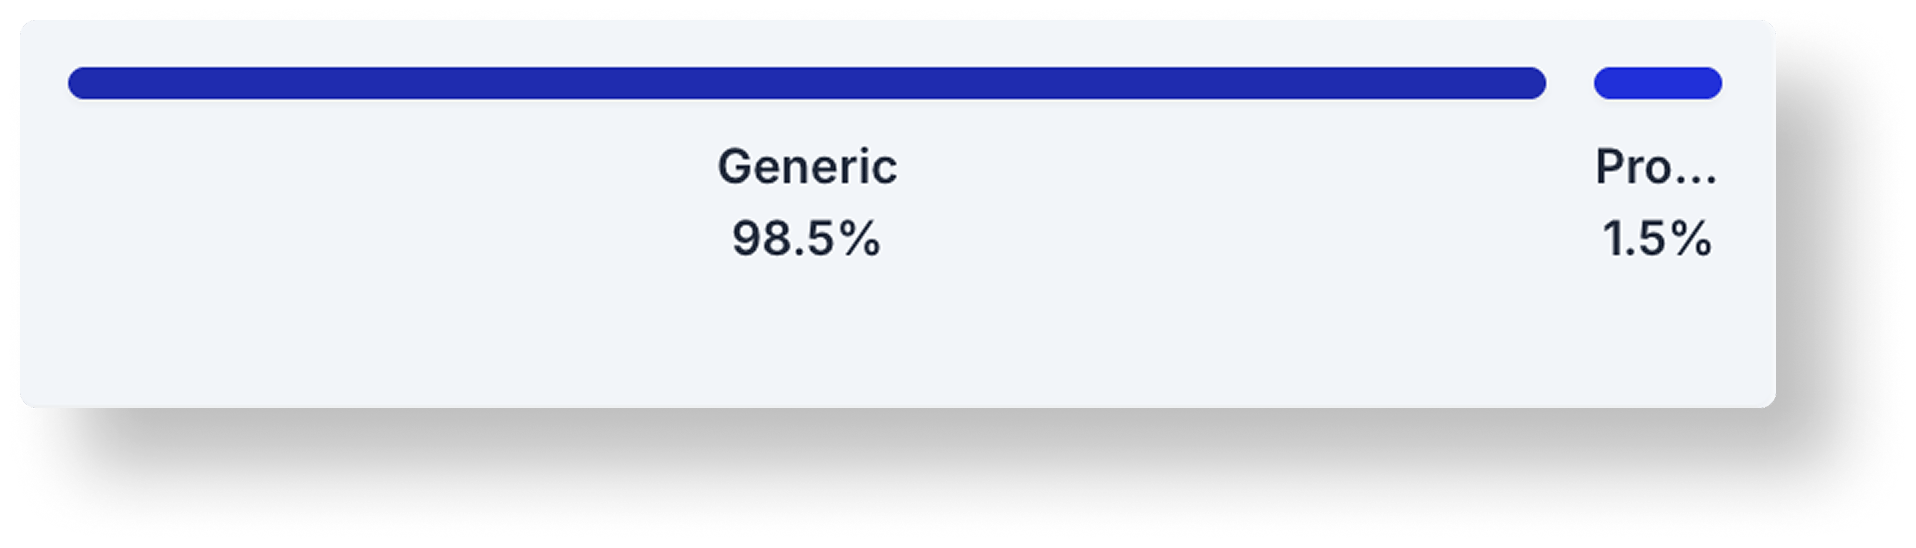 Emission by Environmental Data Type shows the emissions associated with the data types mapped in the Building Component Inventory section of **Material Mapping**.
This calculation includes only the stages **A1–A3, B4, C3, and C4**.
### Emission by Embodied and Operational
Emission by Environmental Data Type shows the emissions associated with the data types mapped in the Building Component Inventory section of **Material Mapping**.
This calculation includes only the stages **A1–A3, B4, C3, and C4**.
### Emission by Embodied and Operational
 The graph shows the share of total emissions split between **embodied carbon** (emissions from material production, construction, and end-of-life processes) and **operational carbon** (emissions from energy use of the building).
Together, they illustrate where carbon impacts occur across the full life cycle.
### Emission by Model
The graph shows the share of total emissions split between **embodied carbon** (emissions from material production, construction, and end-of-life processes) and **operational carbon** (emissions from energy use of the building).
Together, they illustrate where carbon impacts occur across the full life cycle.
### Emission by Model
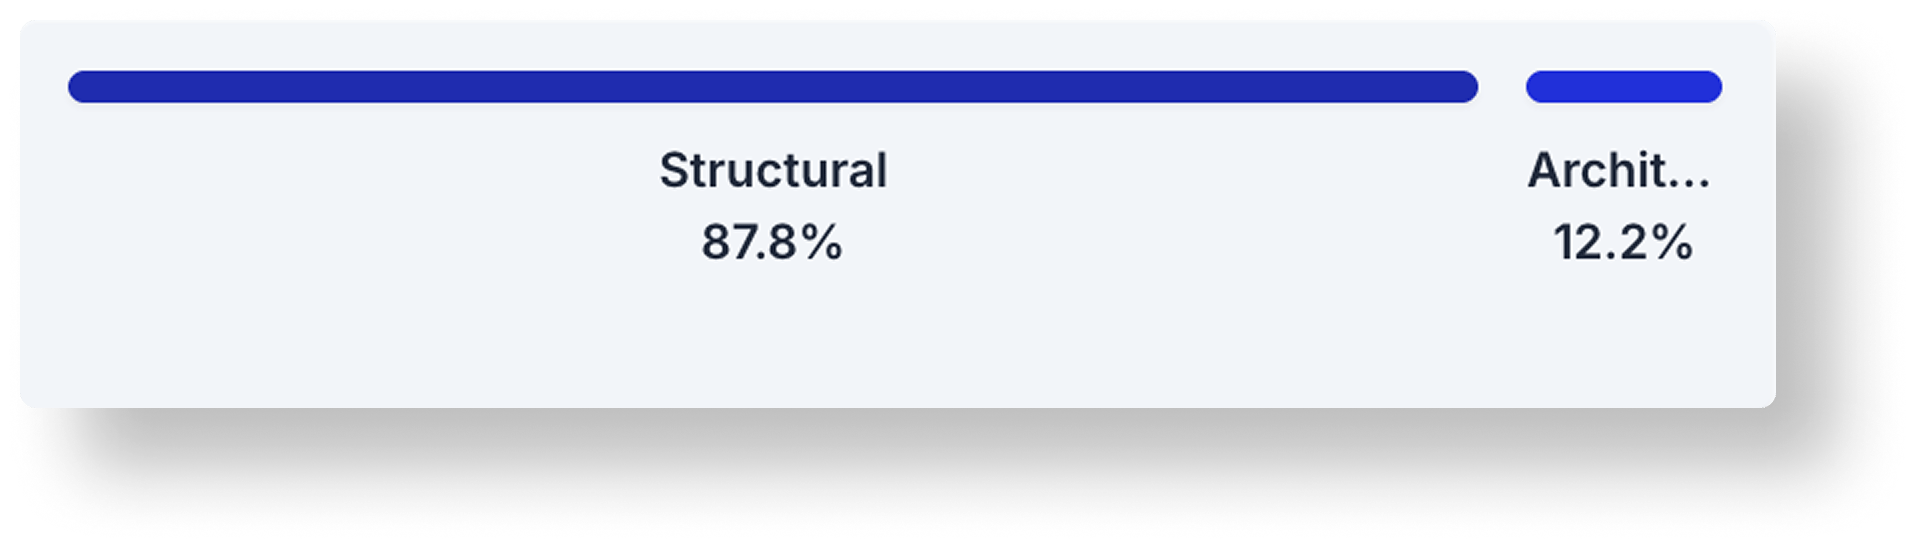 When multiple models are included in your calculation, you can view the emissions for each model individually. This view includes only stages **A1–A3, B4, C3, and C4**.
### Emission by Material Lifecycle Stage
When multiple models are included in your calculation, you can view the emissions for each model individually. This view includes only stages **A1–A3, B4, C3, and C4**.
### Emission by Material Lifecycle Stage
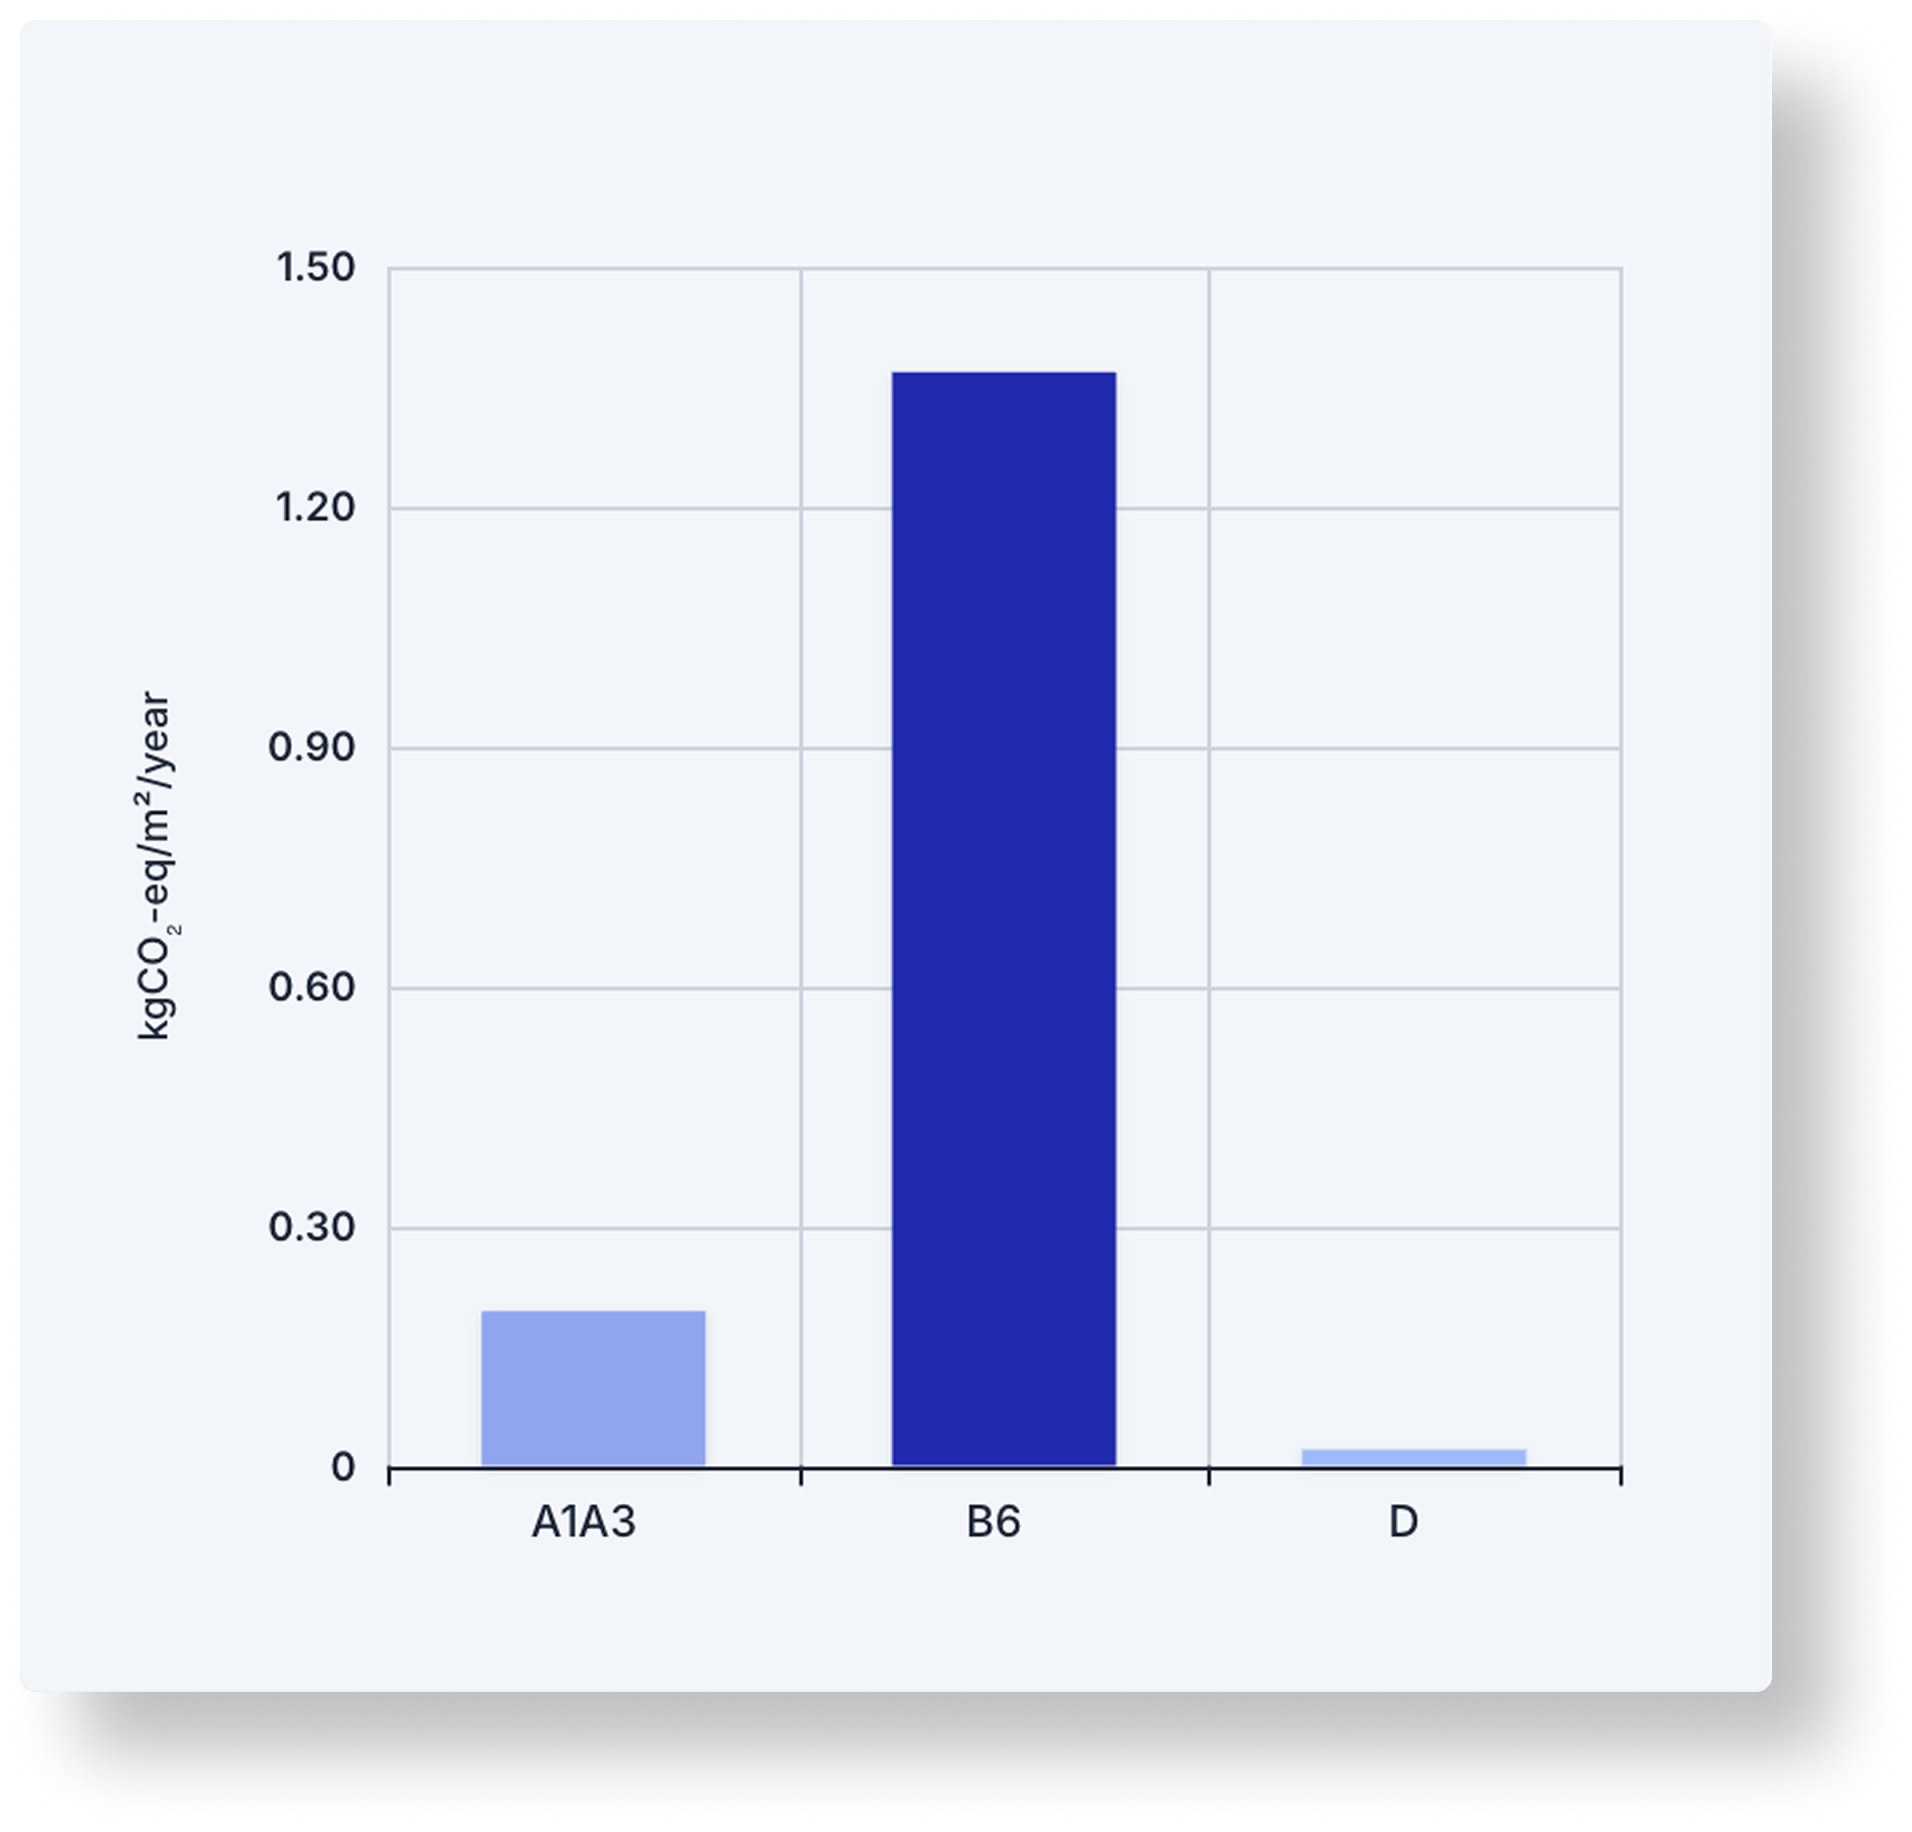 The emissions are distributed across each material lifecycle stage, helping you identify which stages contribute the most to the total footprint. Hover over the stages to learn more.
### Cumulative Emissions
The emissions are distributed across each material lifecycle stage, helping you identify which stages contribute the most to the total footprint. Hover over the stages to learn more.
### Cumulative Emissions
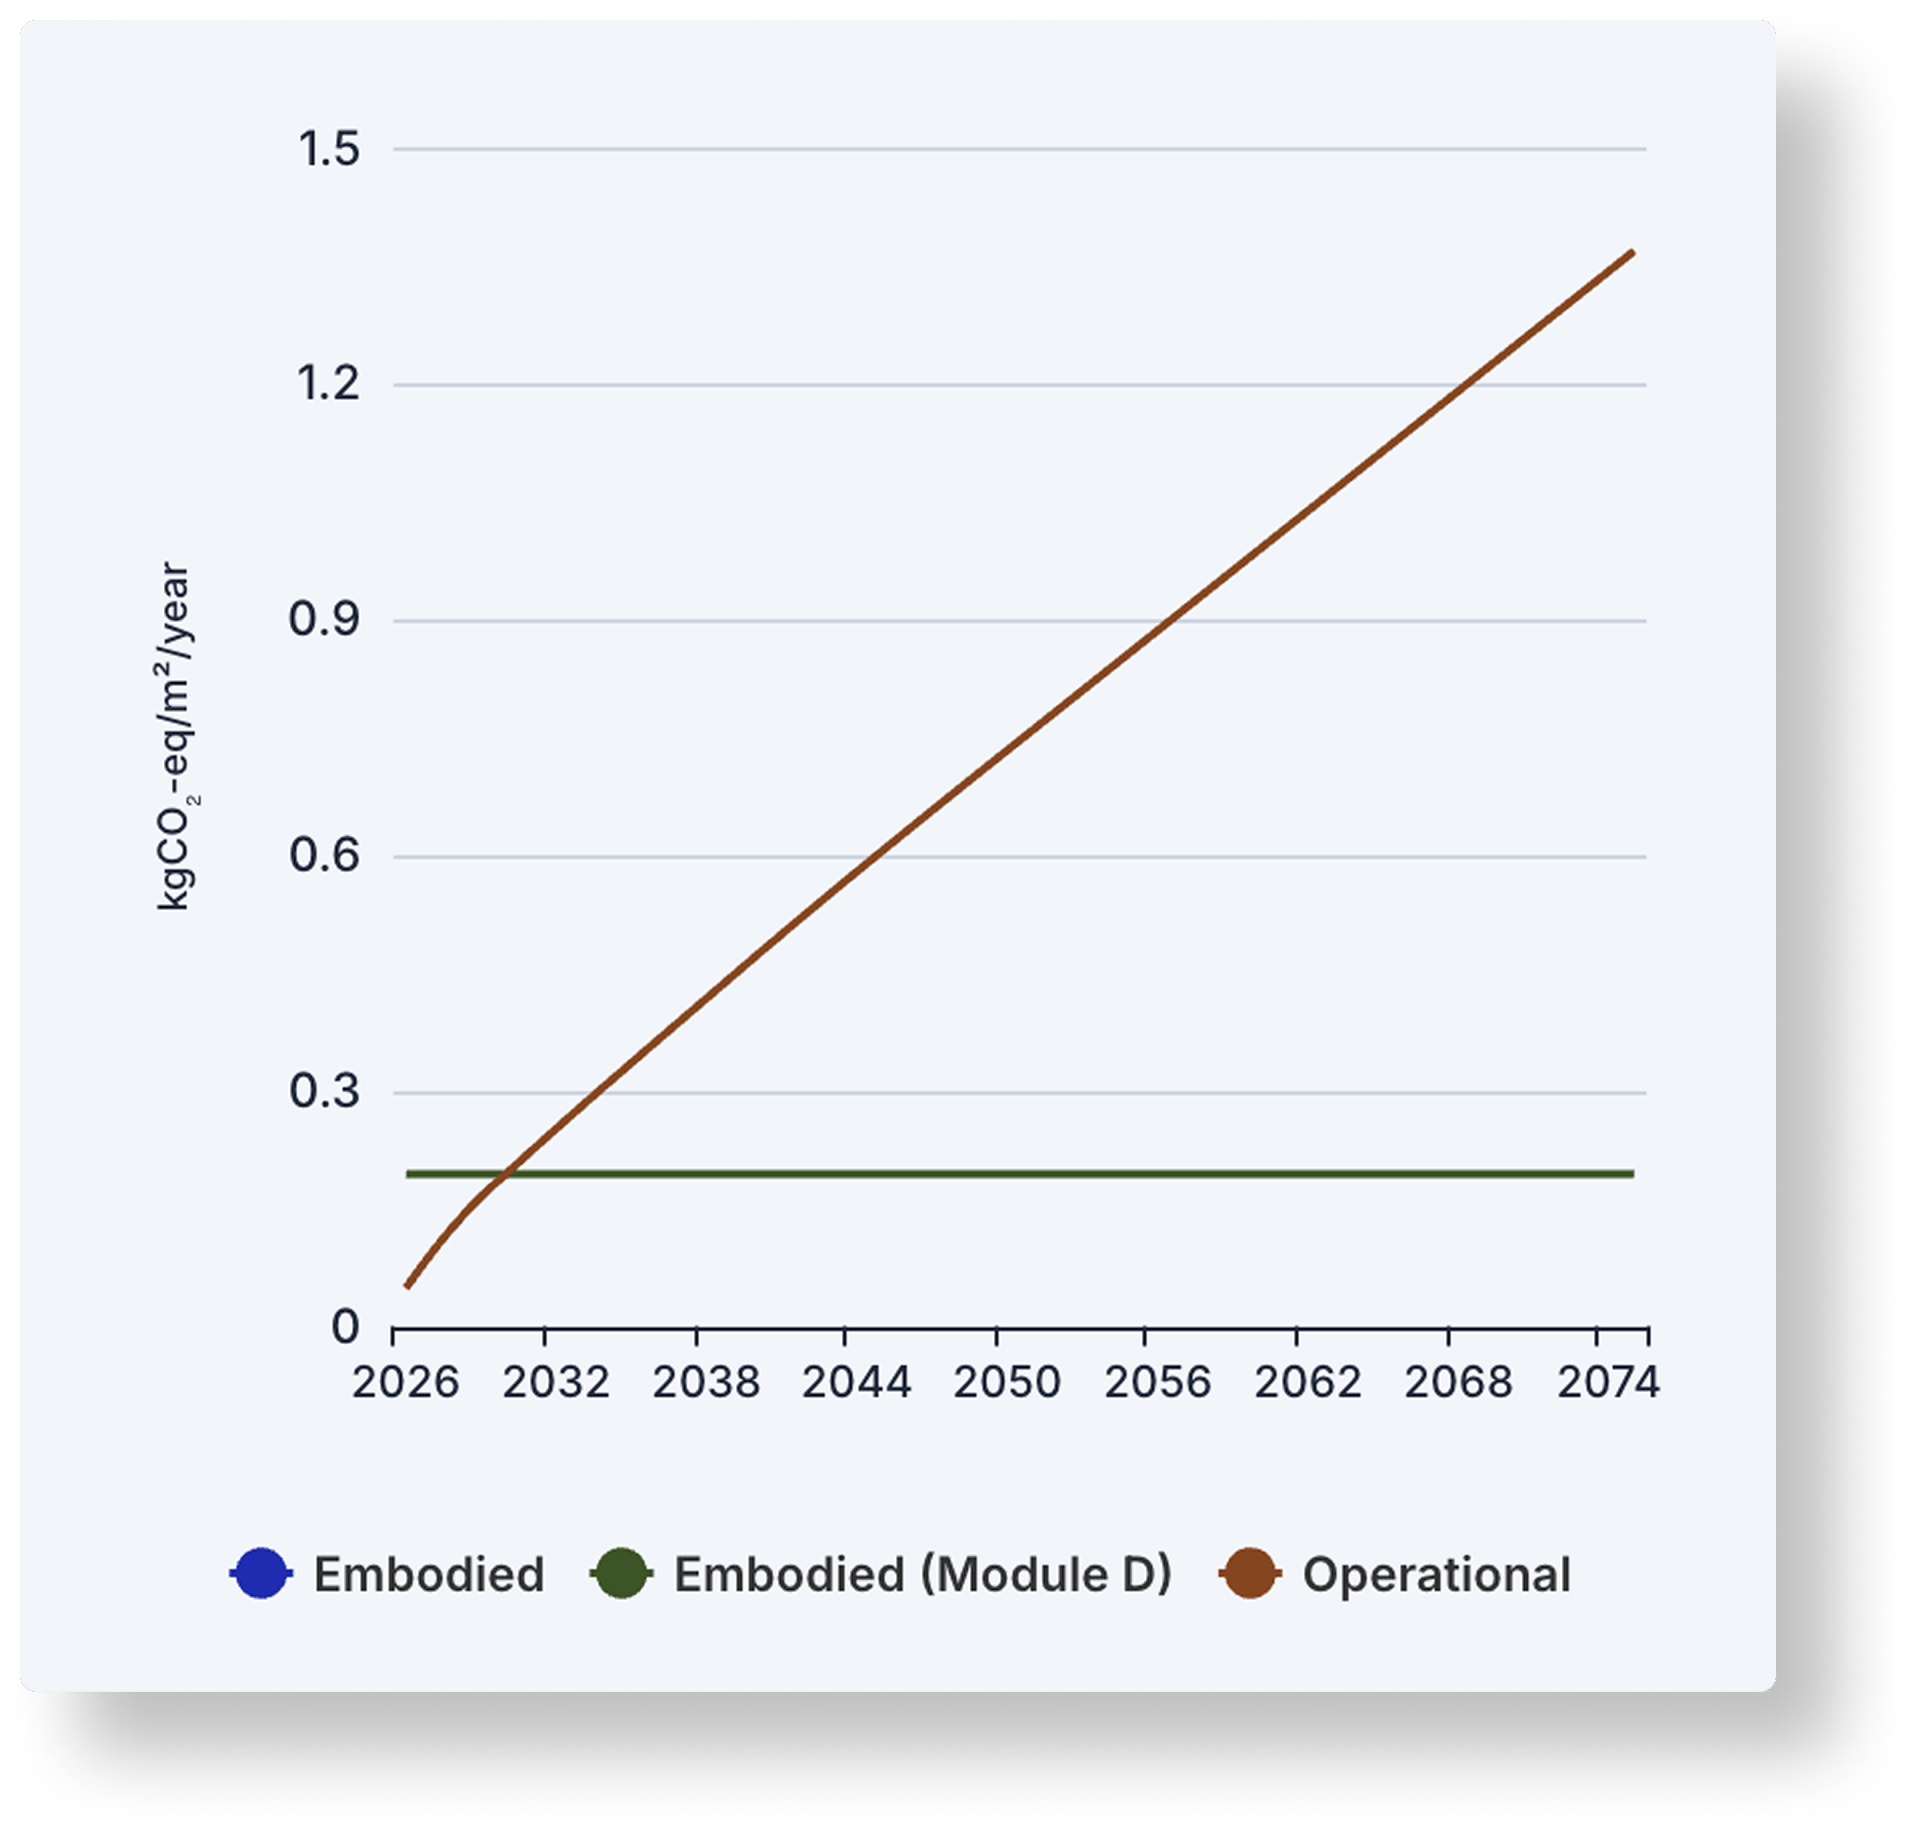 The cumulative emissions graph illustrates how emissions from the building project accumulate year by year over the span of the consideration period. It provides an overview of the project's total climate impact across its entire lifecycle.
**Embodied Emissions** represent the emissions associated with the construction of the building, including material production, transport, construction activities, and — when included — the **D module**, which accounts for potential benefits or burdens beyond the building's life cycle (such as reuse, recycling, or energy recovery).
**Operational Emissions** show the emissions generated during the use phase of the building, primarily from energy consumption for heating, cooling, lighting, and other building operations.
By comparing these components over time, the graph helps illustrate how different lifecycle stages contribute to total emissions and how emissions evolve throughout the building's lifespan.
### Highest Emission Impact by Material
The cumulative emissions graph illustrates how emissions from the building project accumulate year by year over the span of the consideration period. It provides an overview of the project's total climate impact across its entire lifecycle.
**Embodied Emissions** represent the emissions associated with the construction of the building, including material production, transport, construction activities, and — when included — the **D module**, which accounts for potential benefits or burdens beyond the building's life cycle (such as reuse, recycling, or energy recovery).
**Operational Emissions** show the emissions generated during the use phase of the building, primarily from energy consumption for heating, cooling, lighting, and other building operations.
By comparing these components over time, the graph helps illustrate how different lifecycle stages contribute to total emissions and how emissions evolve throughout the building's lifespan.
### Highest Emission Impact by Material
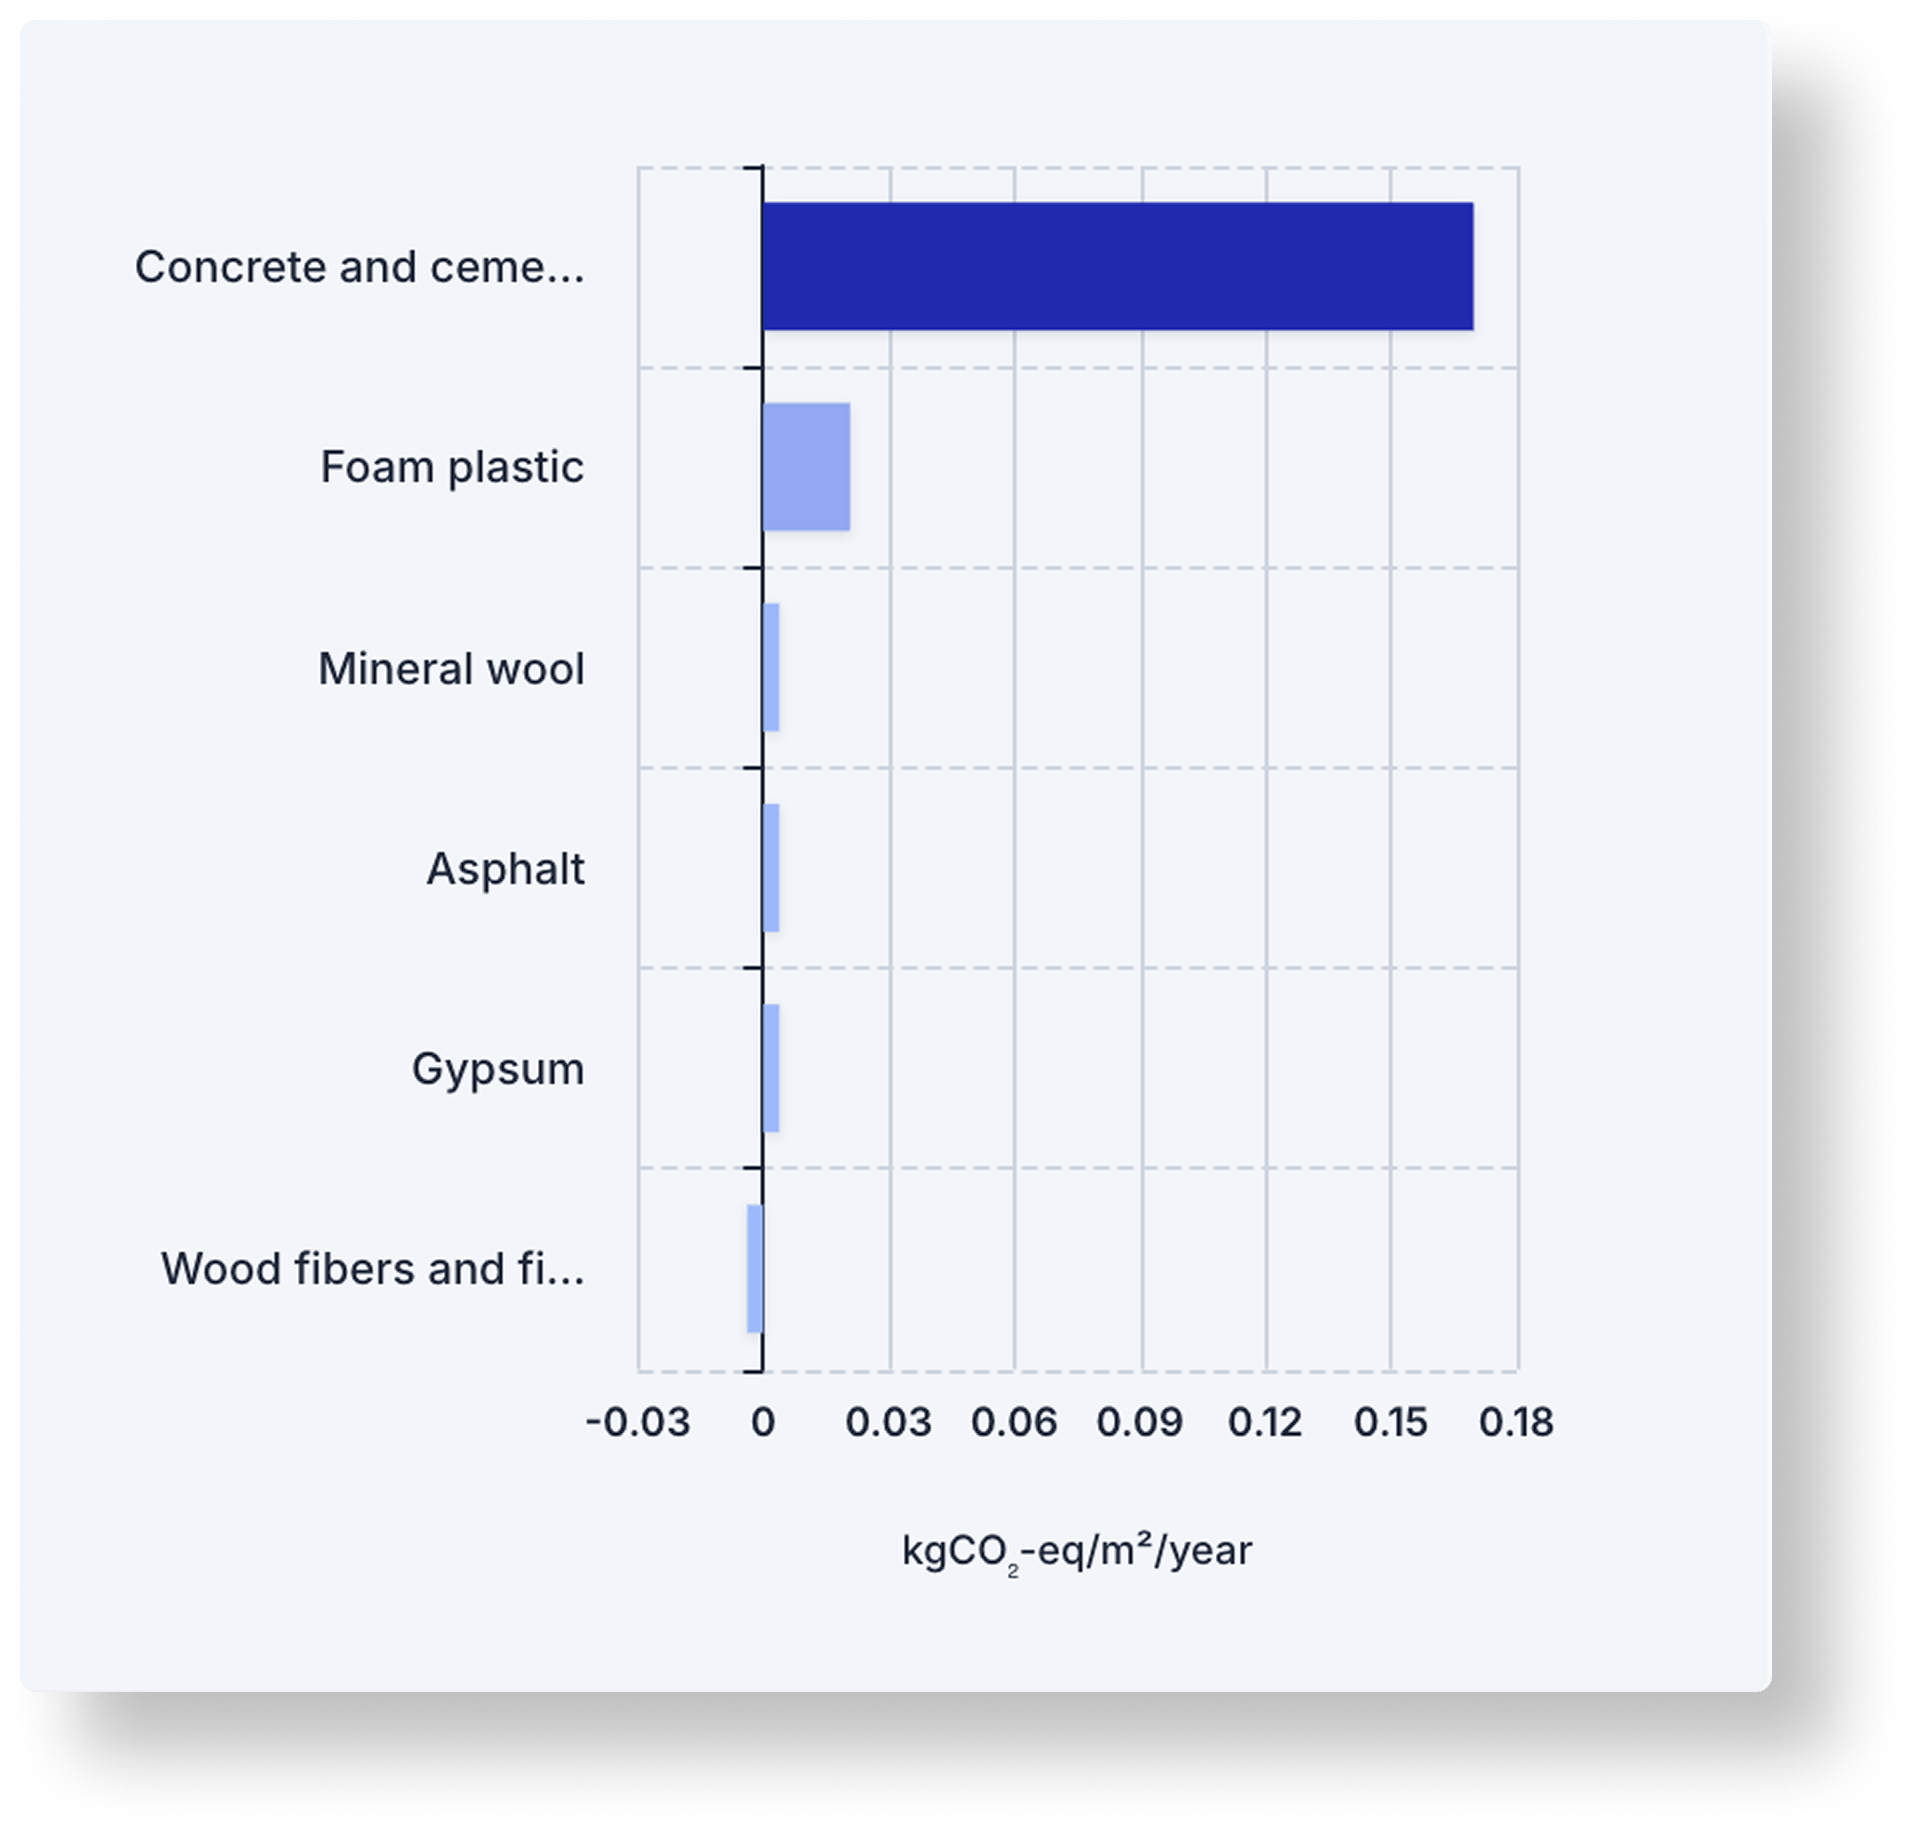 Here is a Hotspot of the **10 most emitting Material Categories** in the project. Click any bar to drill down into that material category and explore the materials and elements that contribute to it.
### Highest Emission Impact by Type
Here is a Hotspot of the **10 most emitting Material Categories** in the project. Click any bar to drill down into that material category and explore the materials and elements that contribute to it.
### Highest Emission Impact by Type
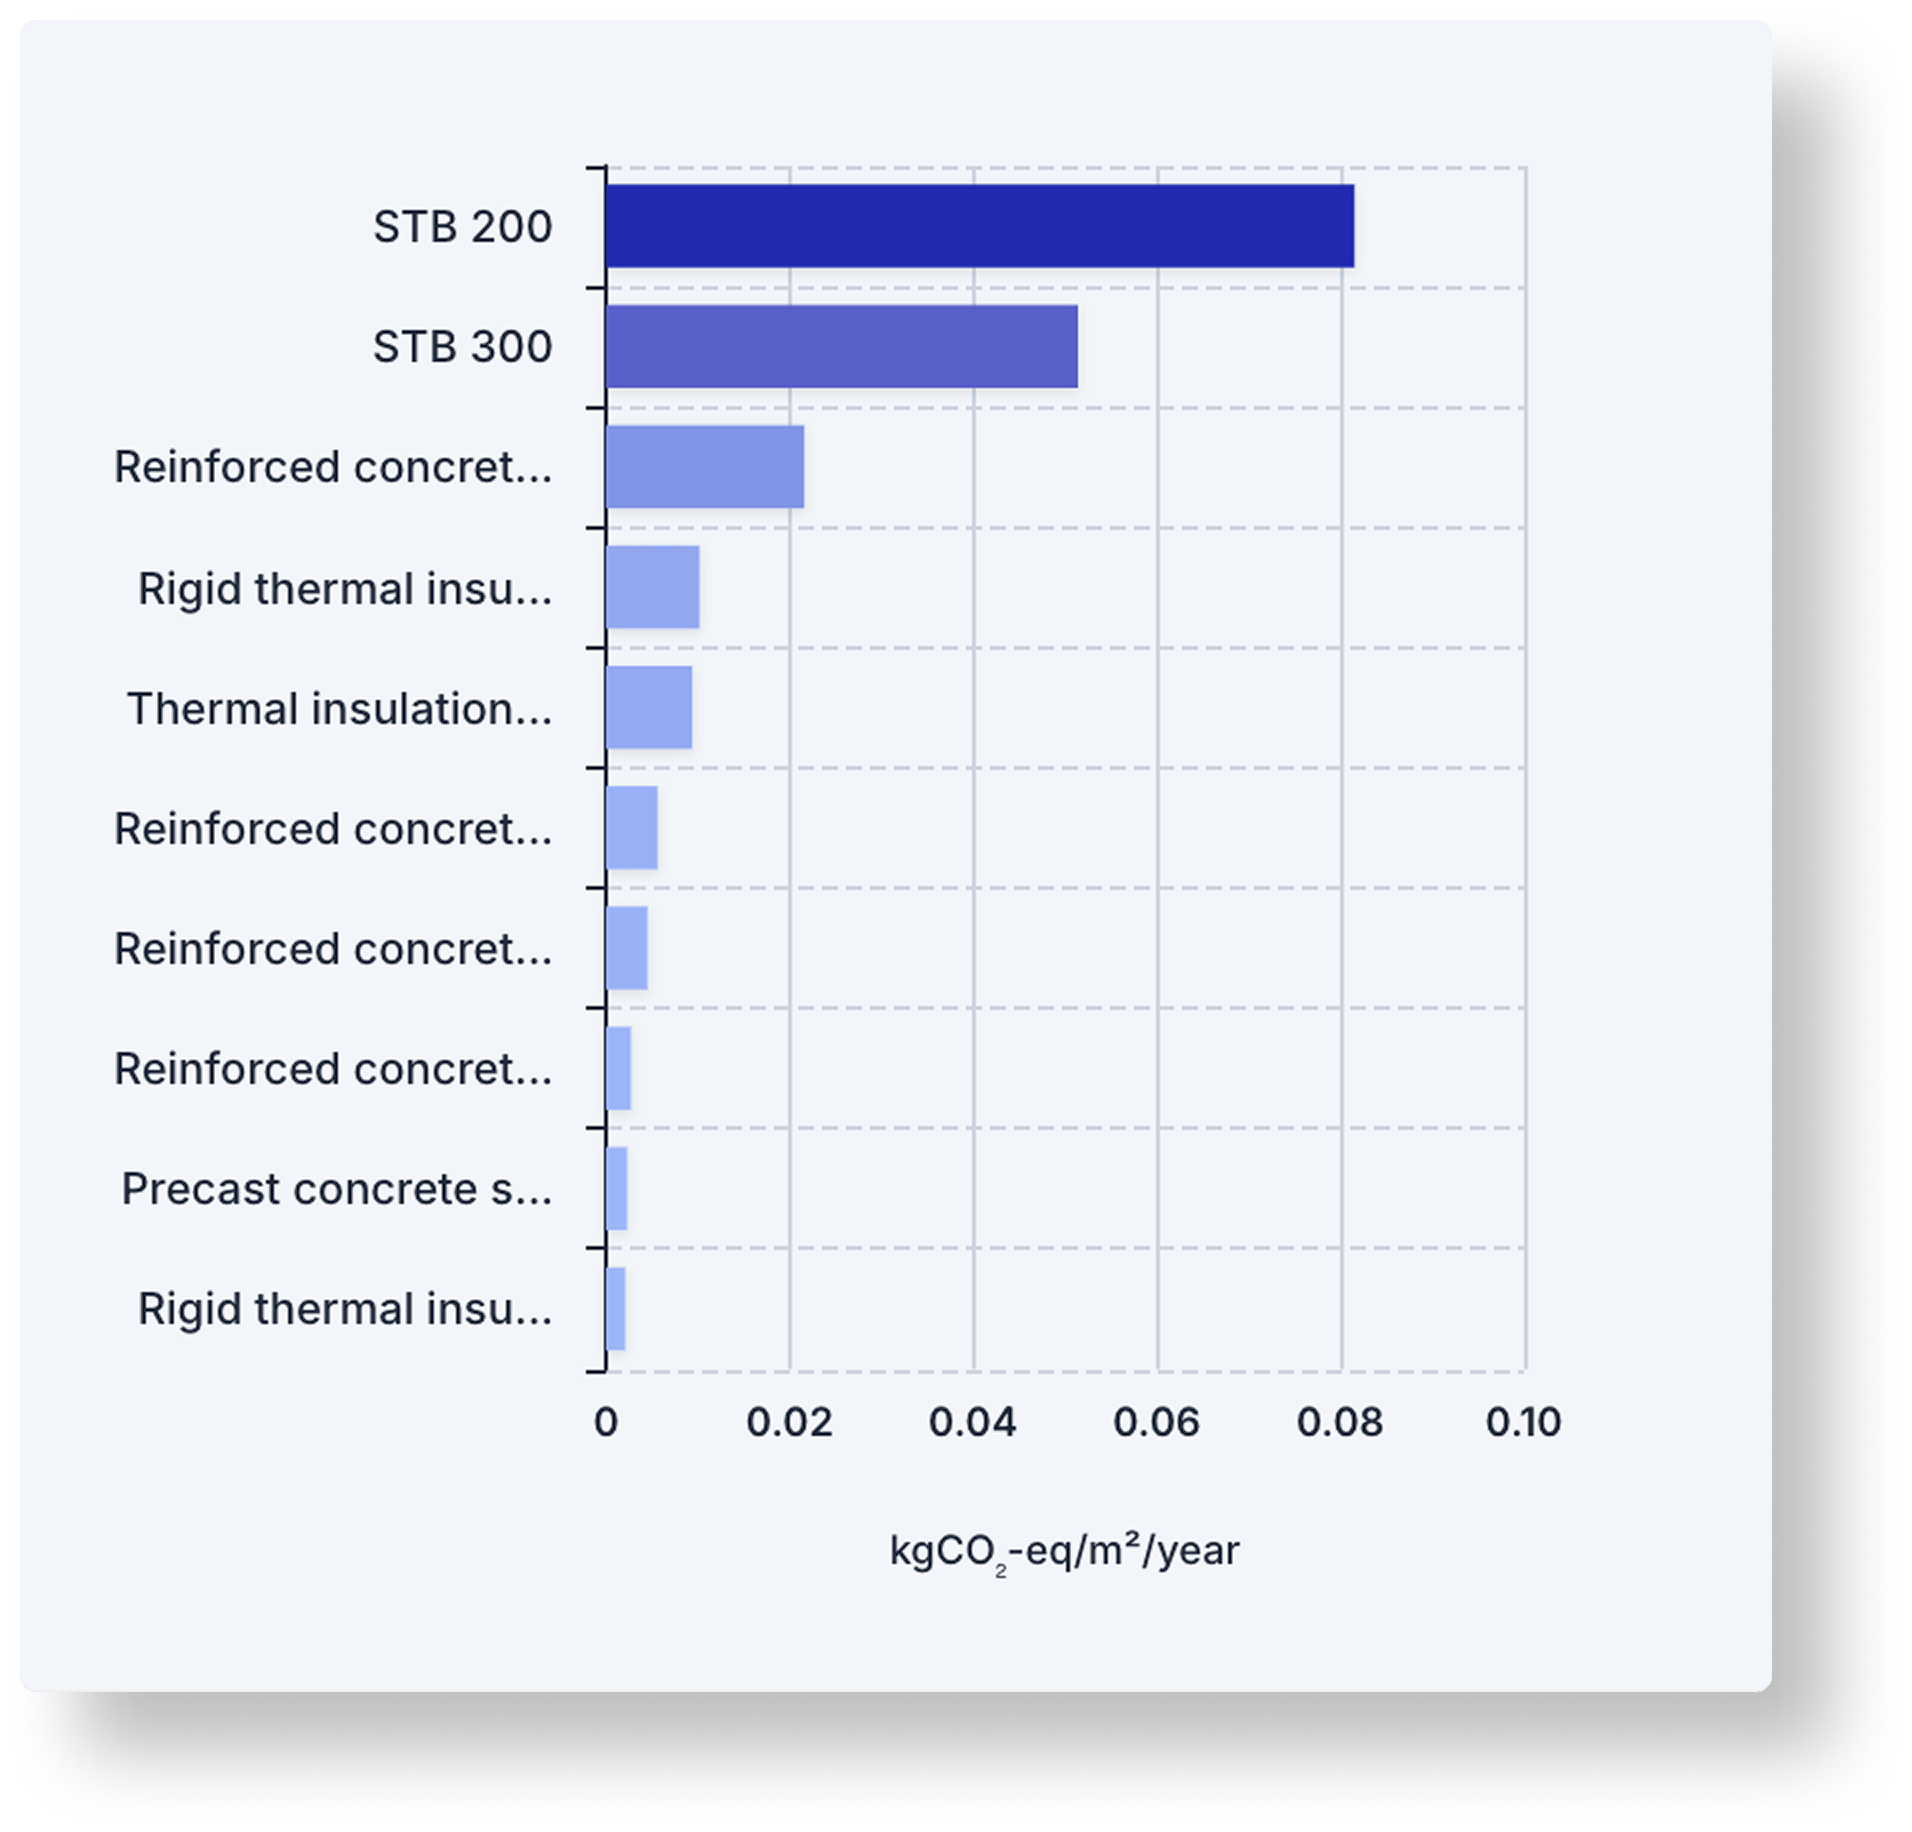 Here is a Hotspot of the **10 most emitting Types** in the project. A Type can include multiple materials. Click any bar to drill down into that type and inspect the underlying materials and elements.
## Project Breakdown
Project Breakdown shows the total emissions for your project, divided into building parts where all material data is listed. You can click on each building part to inspect the materials included in the inventory and explore their detailed emissions.
Here is a Hotspot of the **10 most emitting Types** in the project. A Type can include multiple materials. Click any bar to drill down into that type and inspect the underlying materials and elements.
## Project Breakdown
Project Breakdown shows the total emissions for your project, divided into building parts where all material data is listed. You can click on each building part to inspect the materials included in the inventory and explore their detailed emissions.
 Emission is the sum of all included stages and might therefore deviate from the [Emission overview](#emission-overview).
### Search
Emission is the sum of all included stages and might therefore deviate from the [Emission overview](#emission-overview).
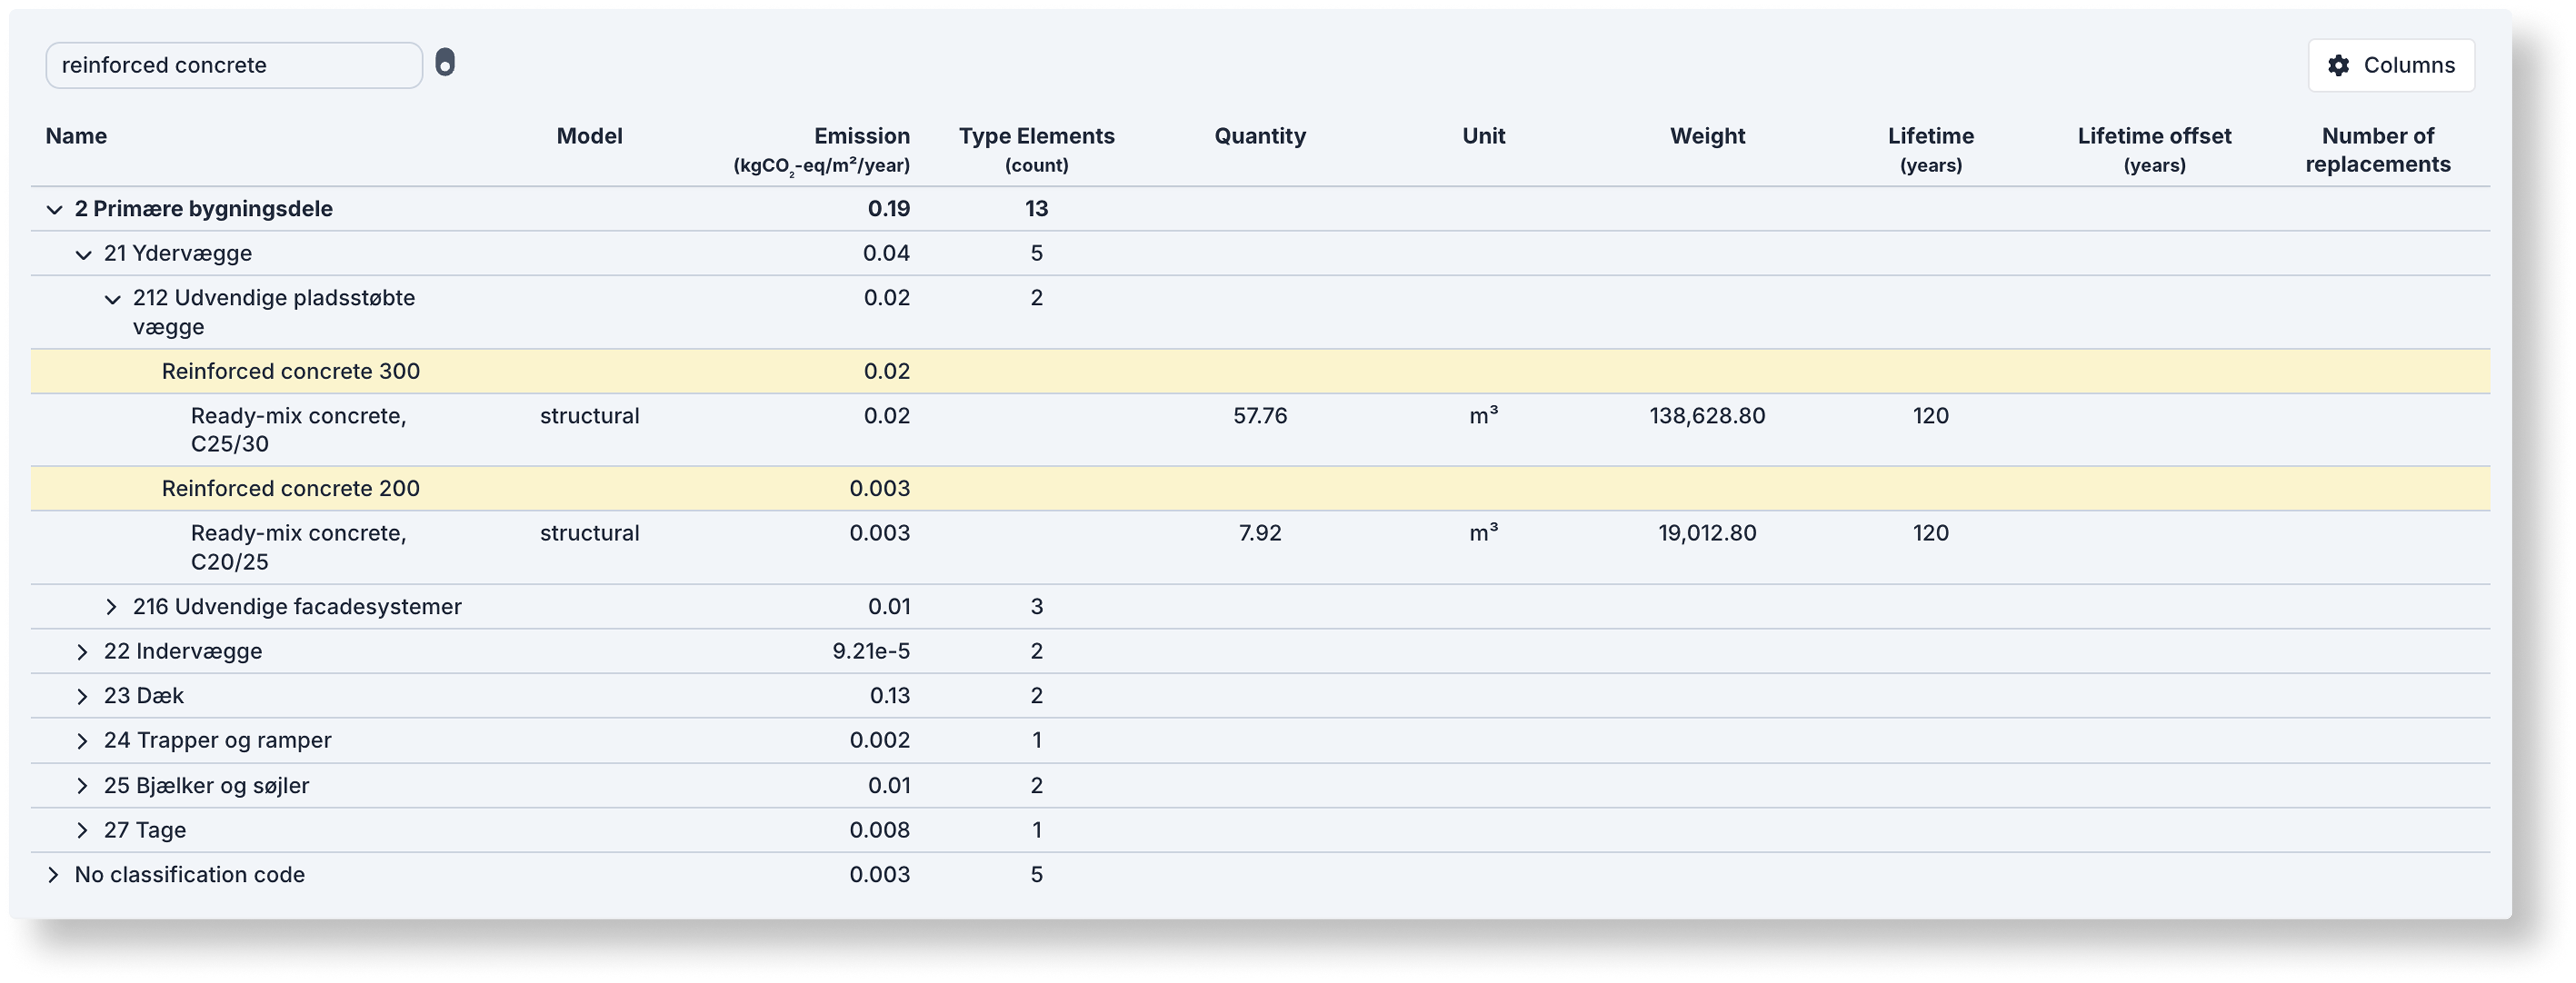
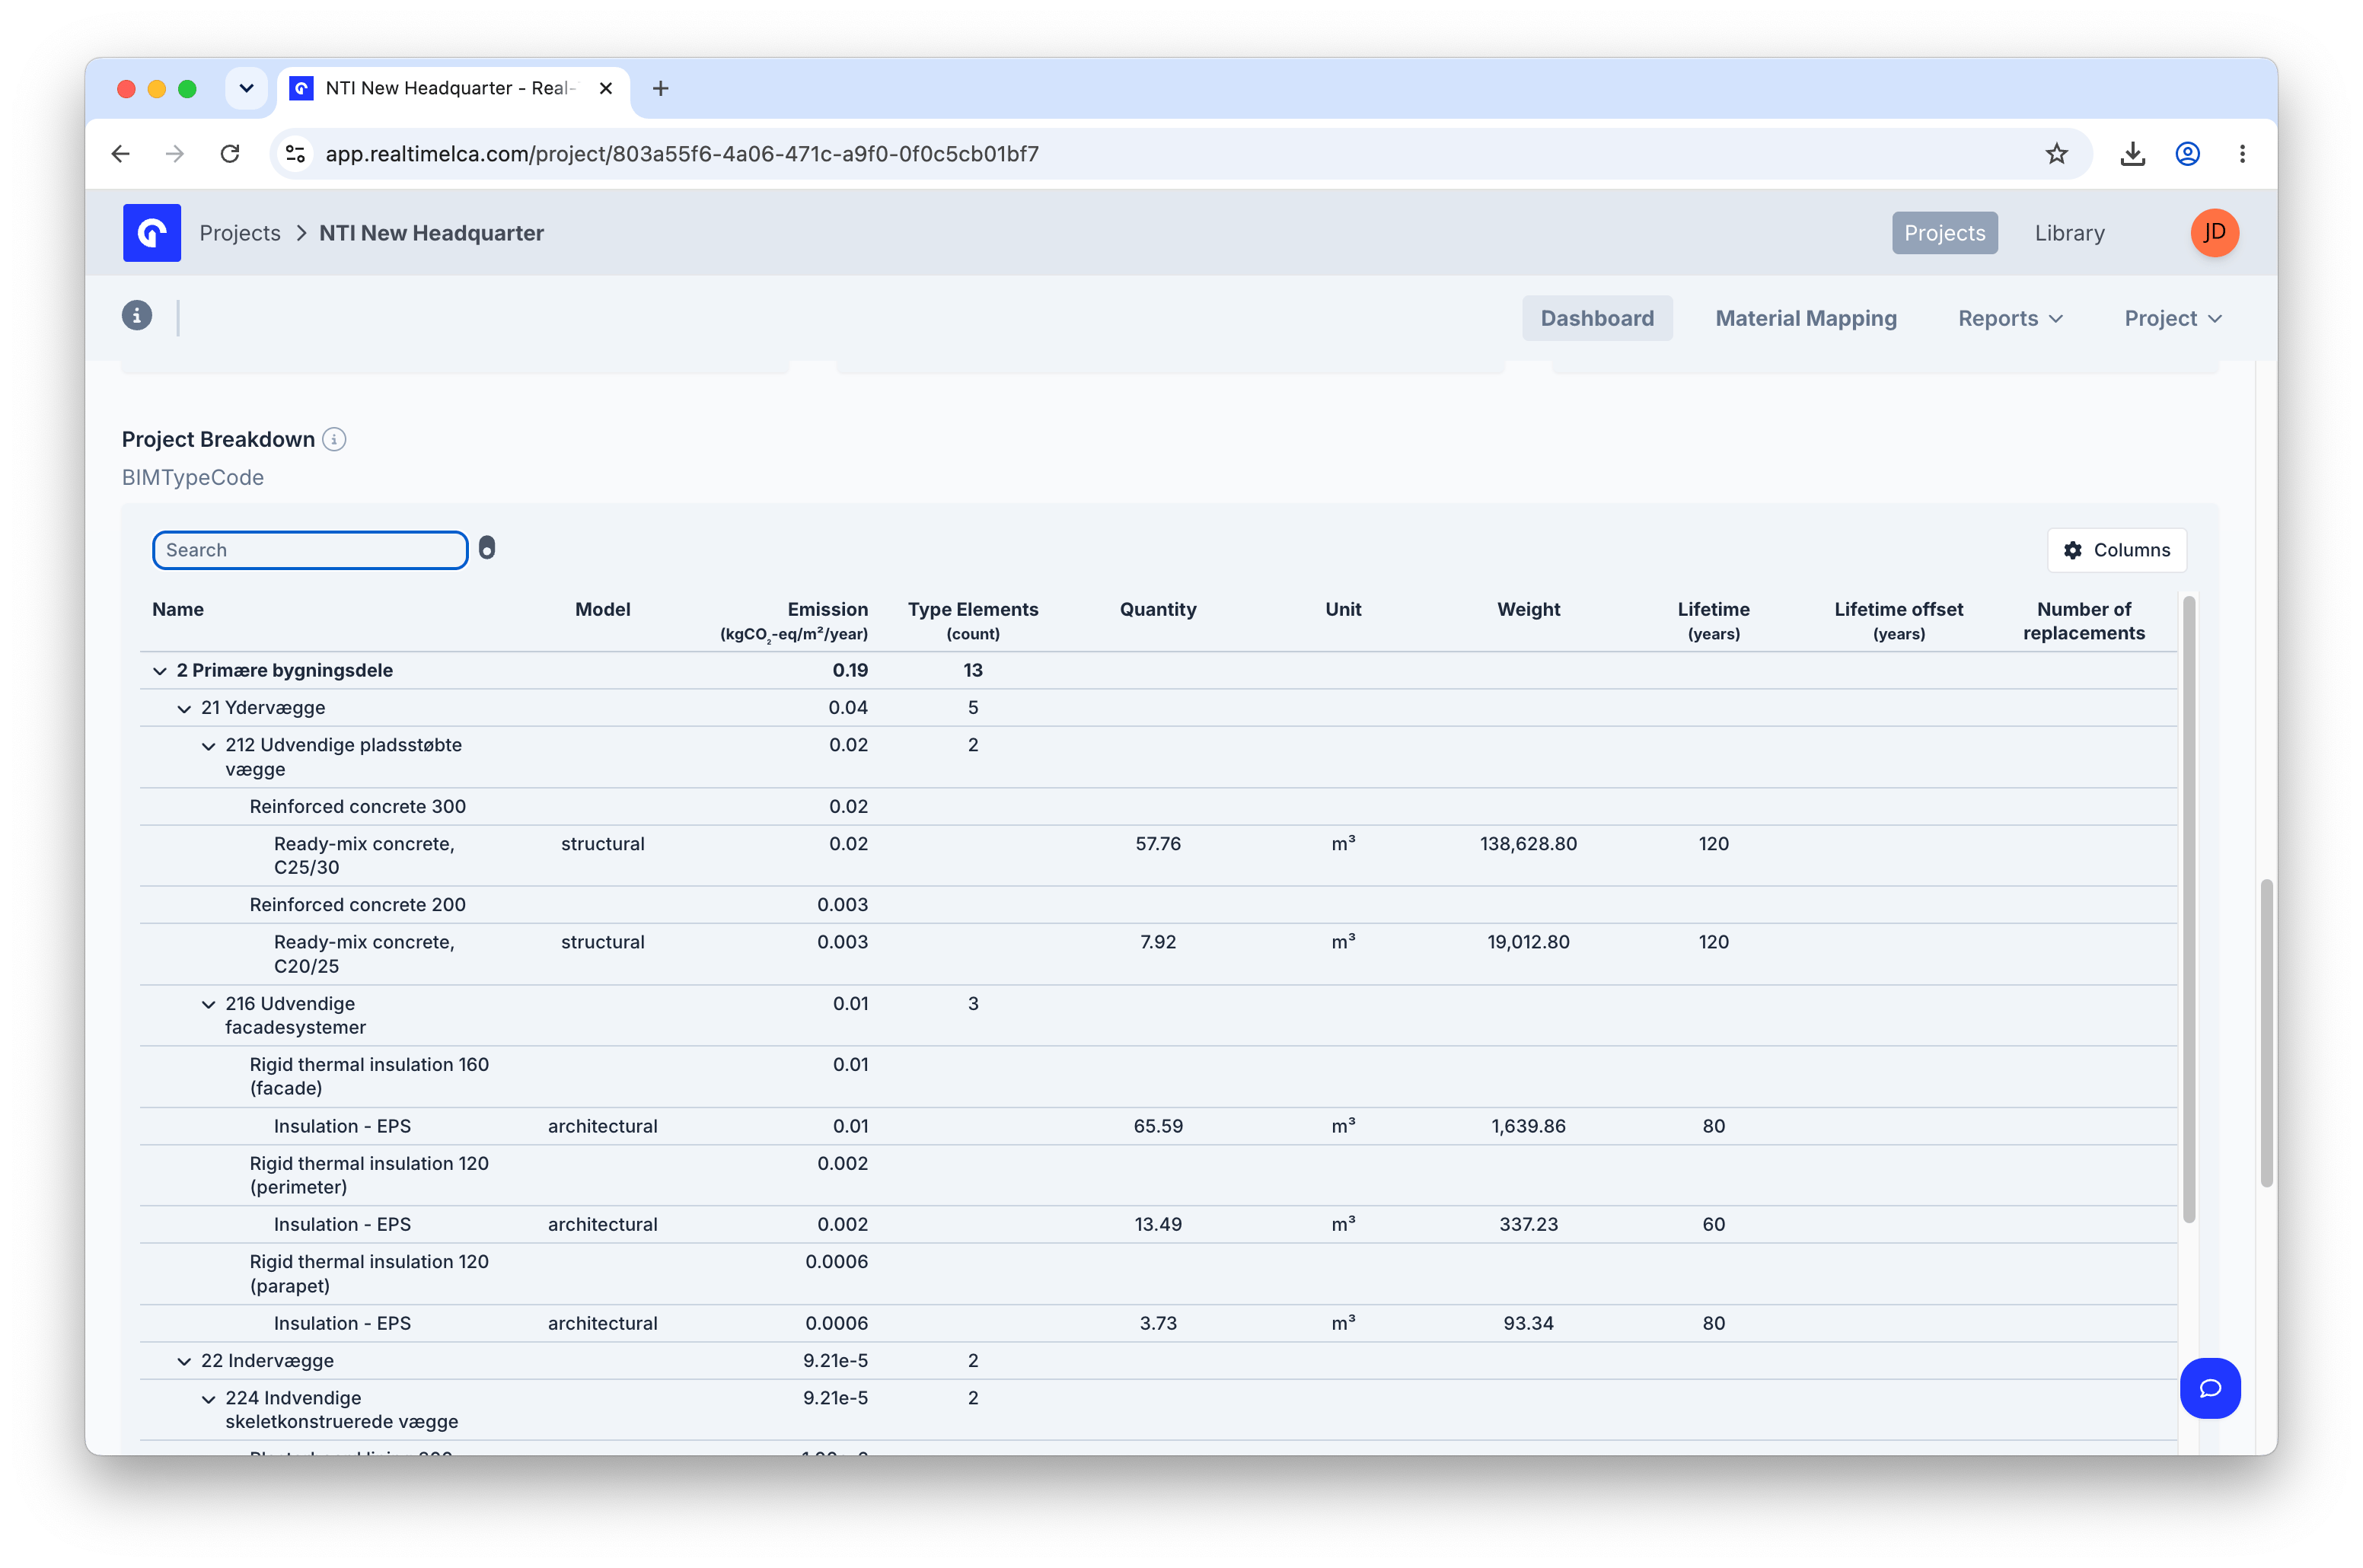
### Search
 Type into the search box above the table to highlight every row whose name matches. Matching rows are tinted yellow so you can spot them even when nested deep inside a building part.
### Expanded
Type into the search box above the table to highlight every row whose name matches. Matching rows are tinted yellow so you can spot them even when nested deep inside a building part.
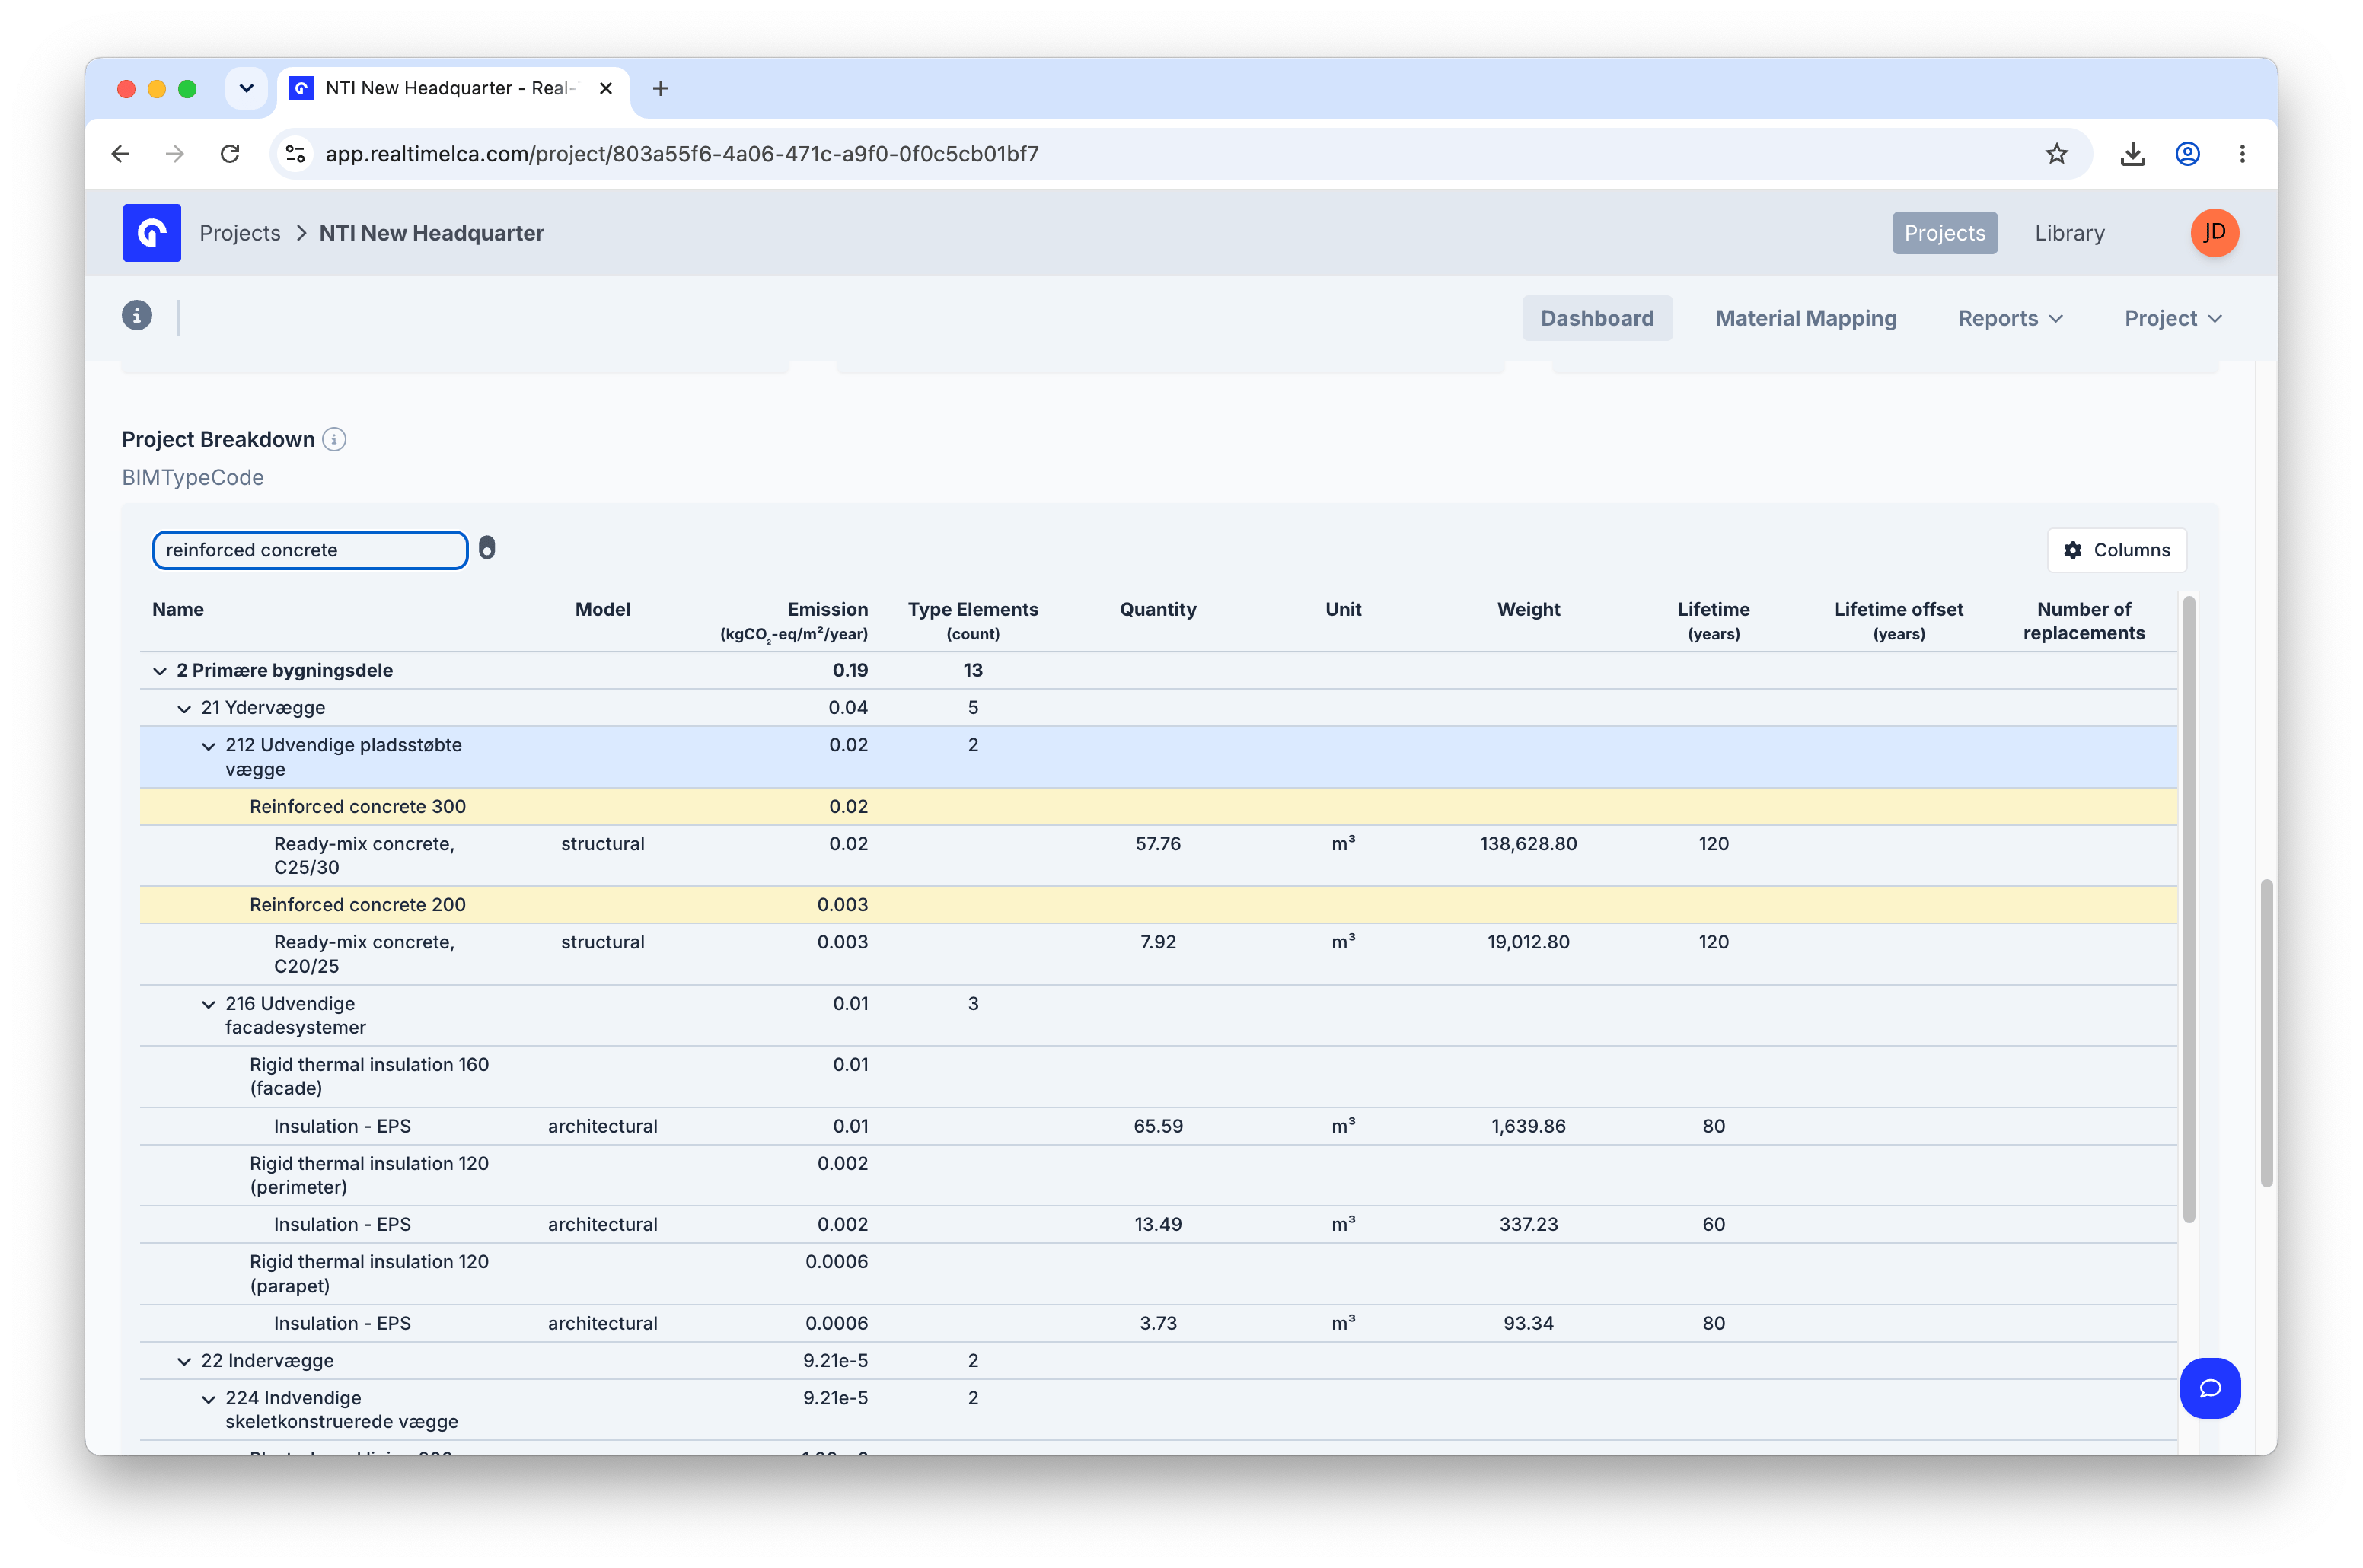
### Expanded
 Click the chevron next to any building part to drill down through types and individual materials. Each leaf row shows the material's quantity, unit, weight, lifetime, and replacement count alongside its emission.
### Columns reorder
Click the chevron next to any building part to drill down through types and individual materials. Each leaf row shows the material's quantity, unit, weight, lifetime, and replacement count alongside its emission.
### Columns reorder
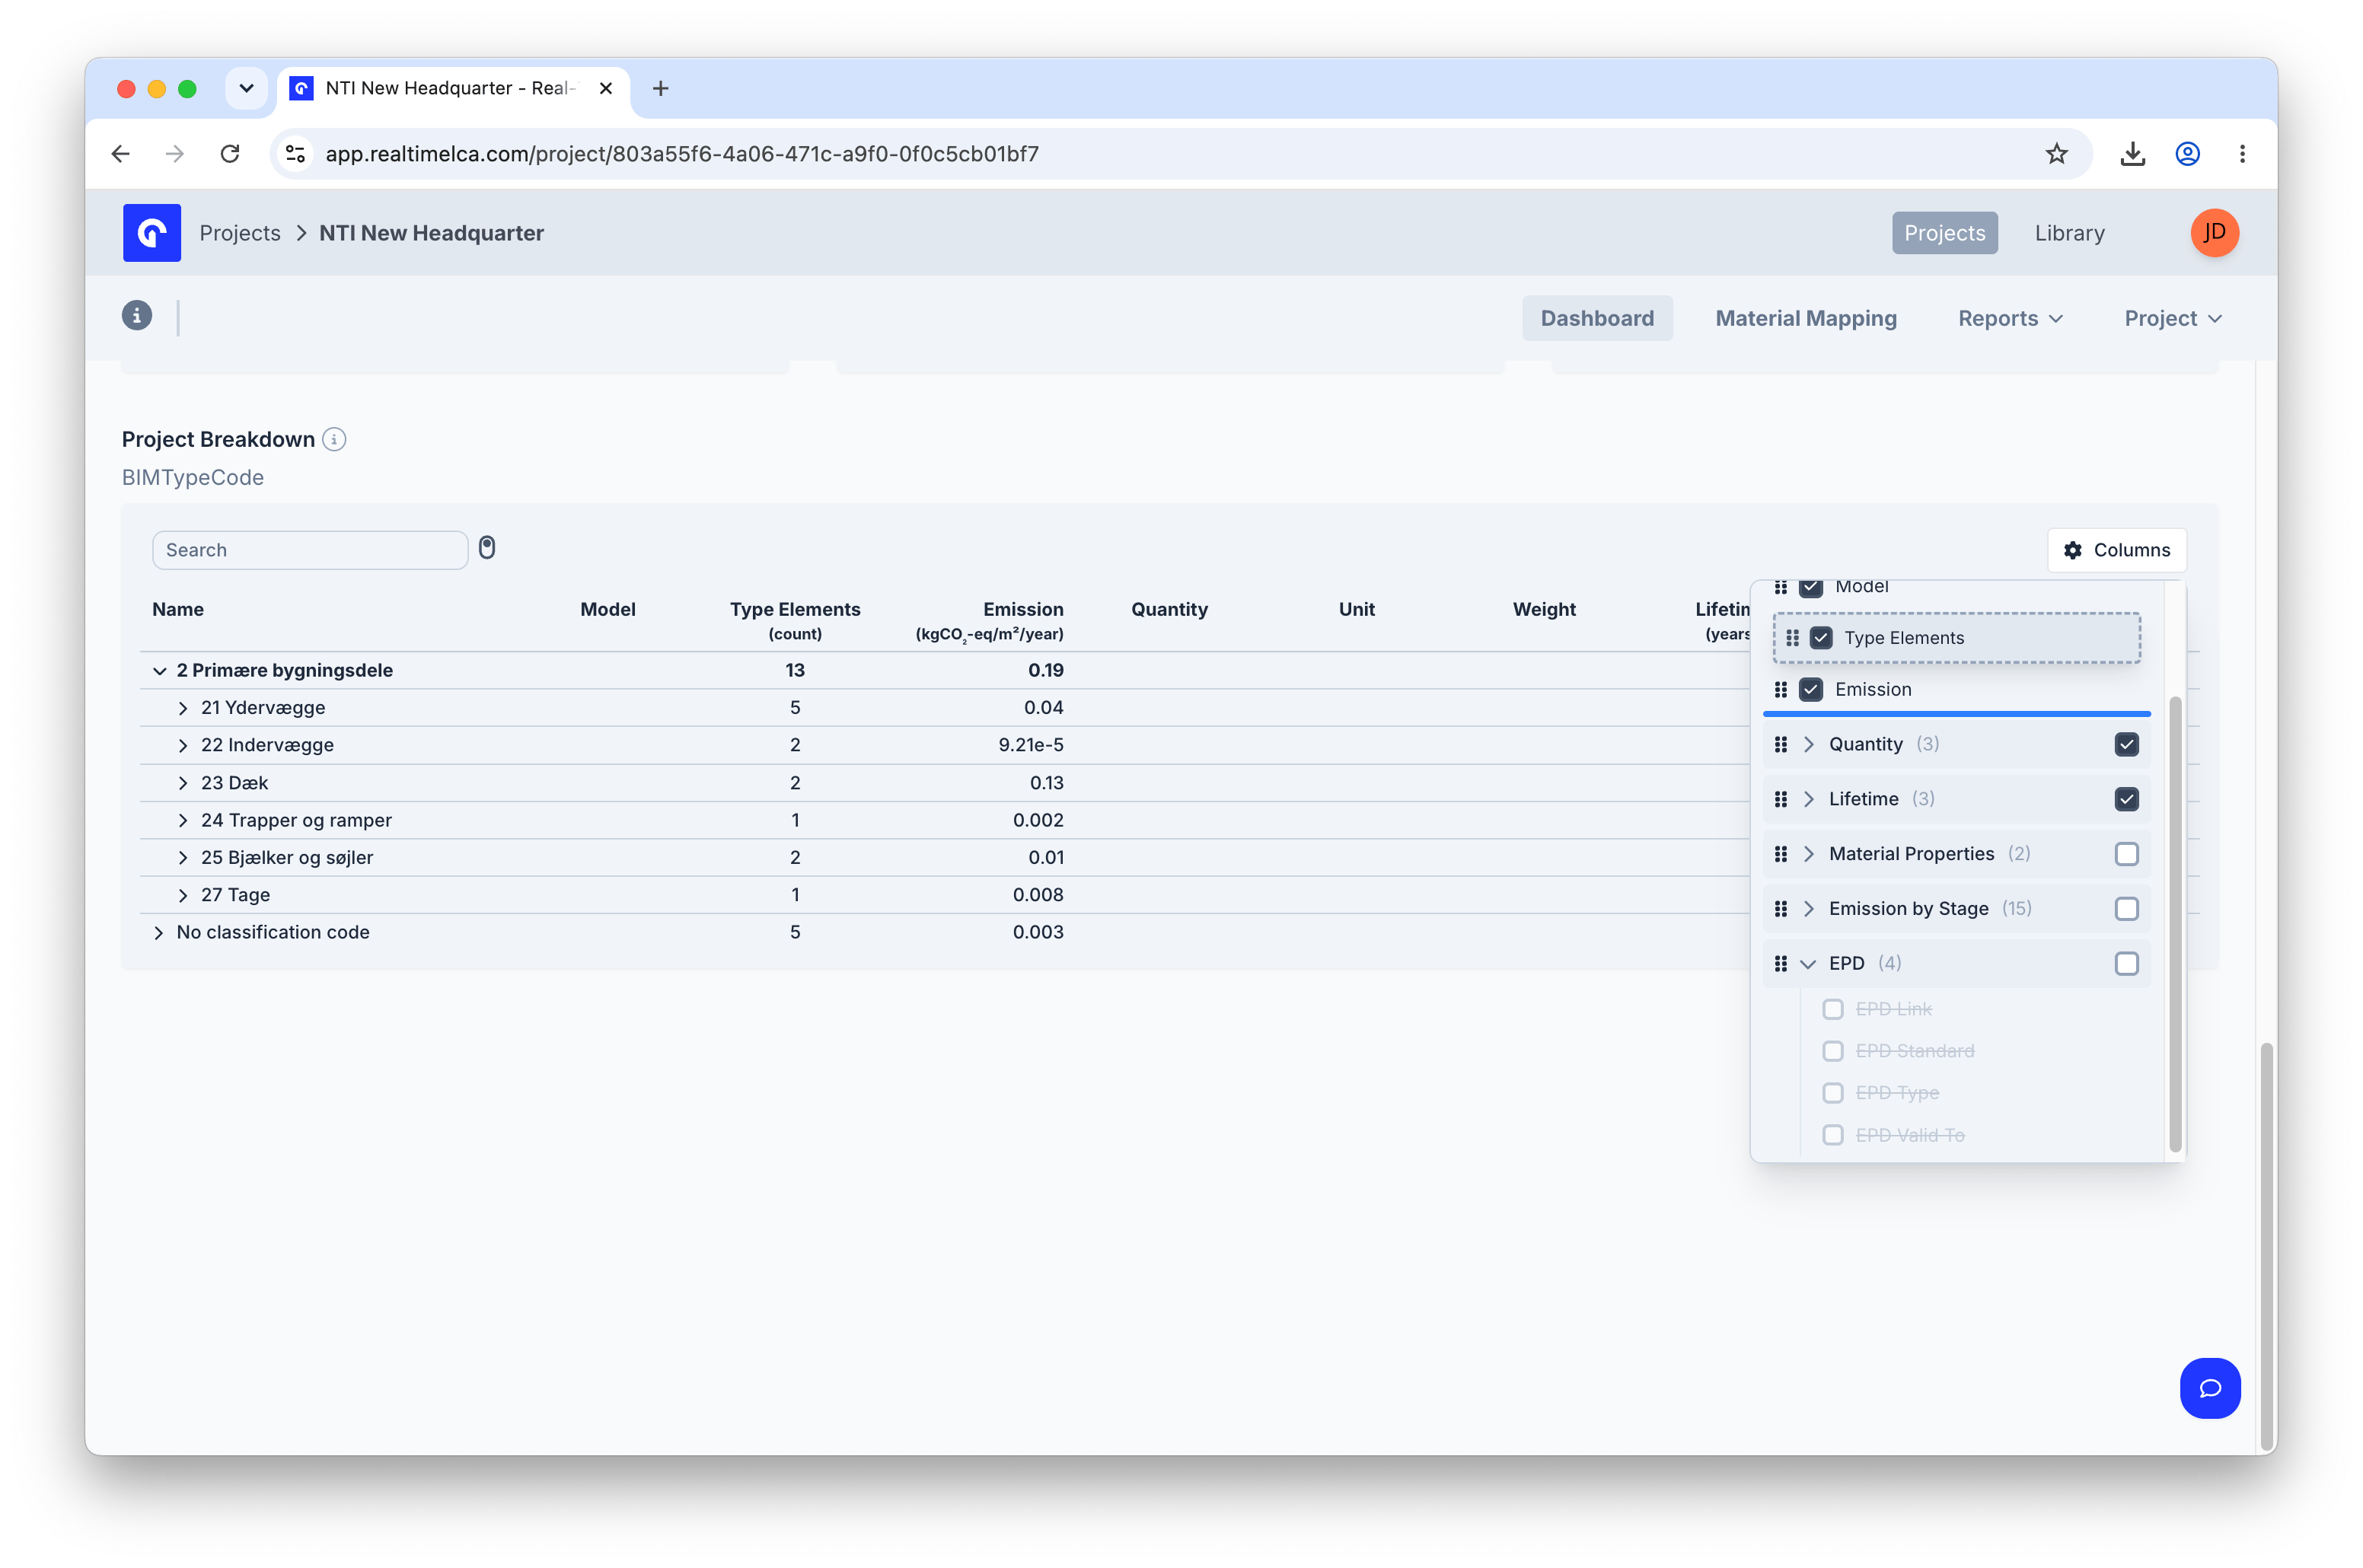 Open **Columns** in the top-right of the table to choose which columns are visible and to reorder them by dragging the handle on the left of each row. Groups like **Material Properties**, **Emission by Stage**, and **EPD** can be toggled together.
## Project data
Open **Columns** in the top-right of the table to choose which columns are visible and to reorder them by dragging the handle on the left of each row. Groups like **Material Properties**, **Emission by Stage**, and **EPD** can be toggled together.
## Project data
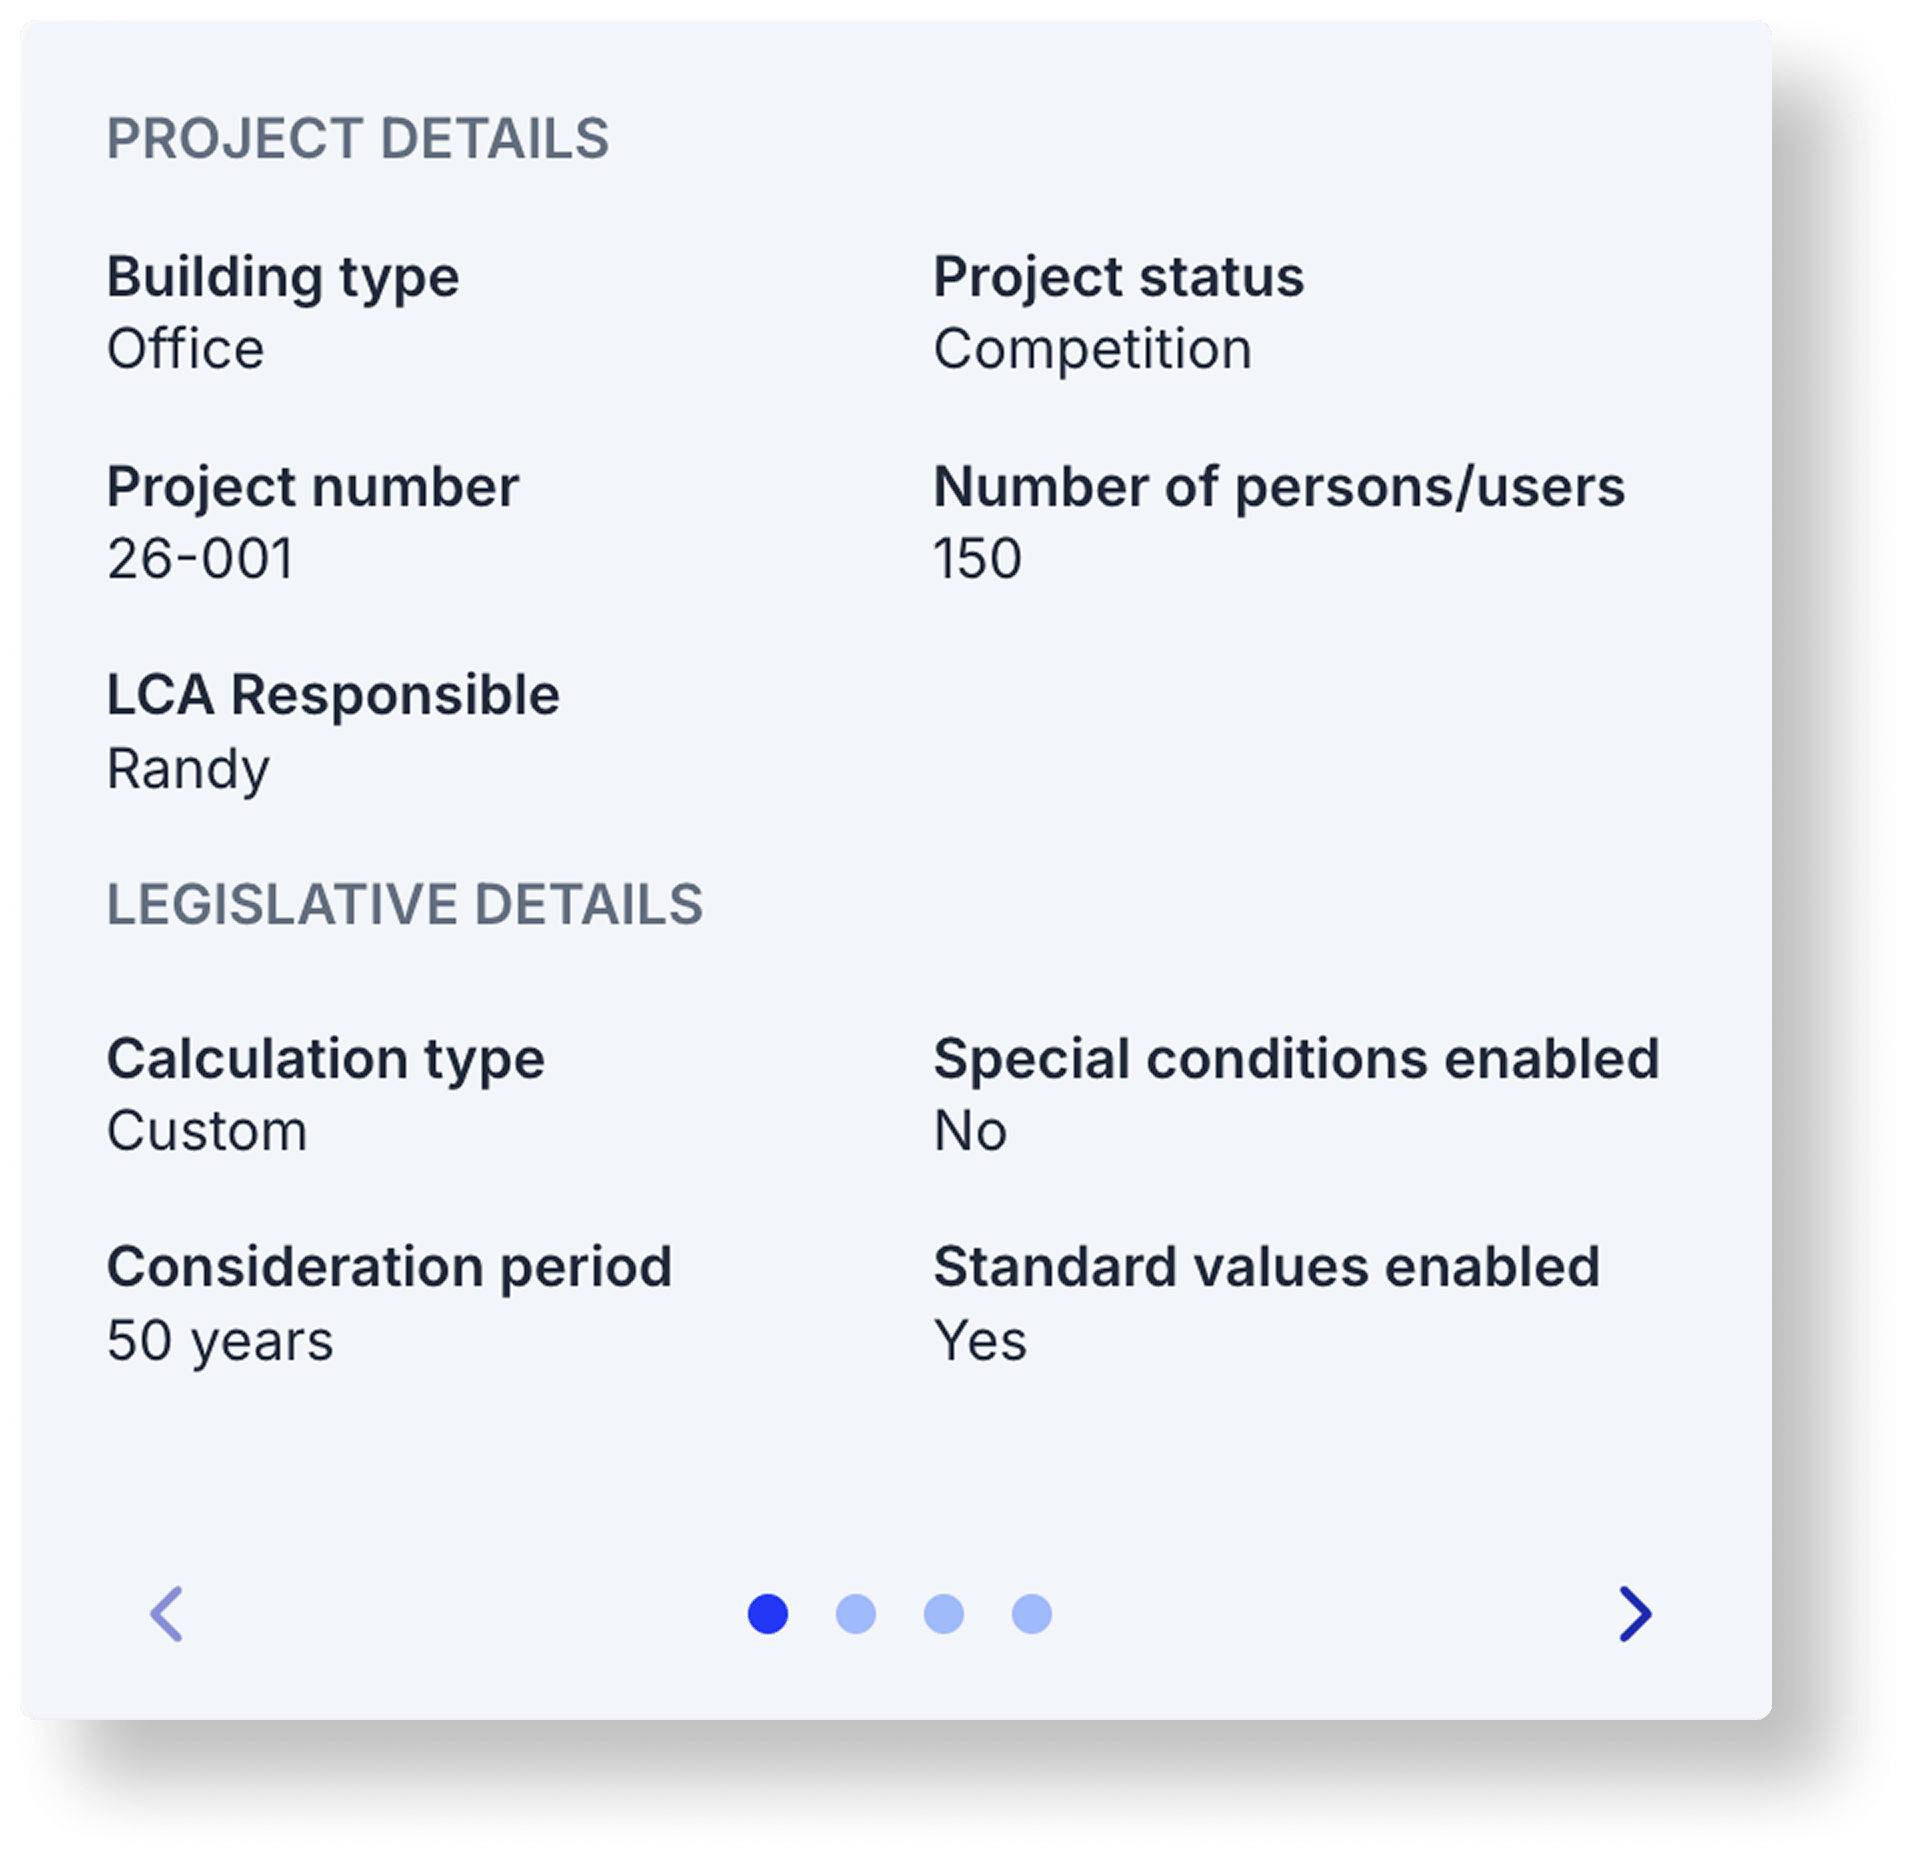 The **Project data** sidebar on the right of the dashboard summarises the project's setup. Use the arrows at the bottom of the card to page through the sections — **Project Details**, **Legislative Details**, and the other pages indicated by the dots. The values come from the project wizard; change them via [Edit Project](#edit-a-project).
Cross-reference the legislative entries with [Methodology & Compliance](/methodology-and-compliance/iso-standards) when you need to justify a setting in a report.
## Reports
The **Reports** tab in the dashboard header opens a dropdown of frameworks available for the project's location.
### Dropdown
The **Project data** sidebar on the right of the dashboard summarises the project's setup. Use the arrows at the bottom of the card to page through the sections — **Project Details**, **Legislative Details**, and the other pages indicated by the dots. The values come from the project wizard; change them via [Edit Project](#edit-a-project).
Cross-reference the legislative entries with [Methodology & Compliance](/methodology-and-compliance/iso-standards) when you need to justify a setting in a report.
## Reports
The **Reports** tab in the dashboard header opens a dropdown of frameworks available for the project's location.
### Dropdown
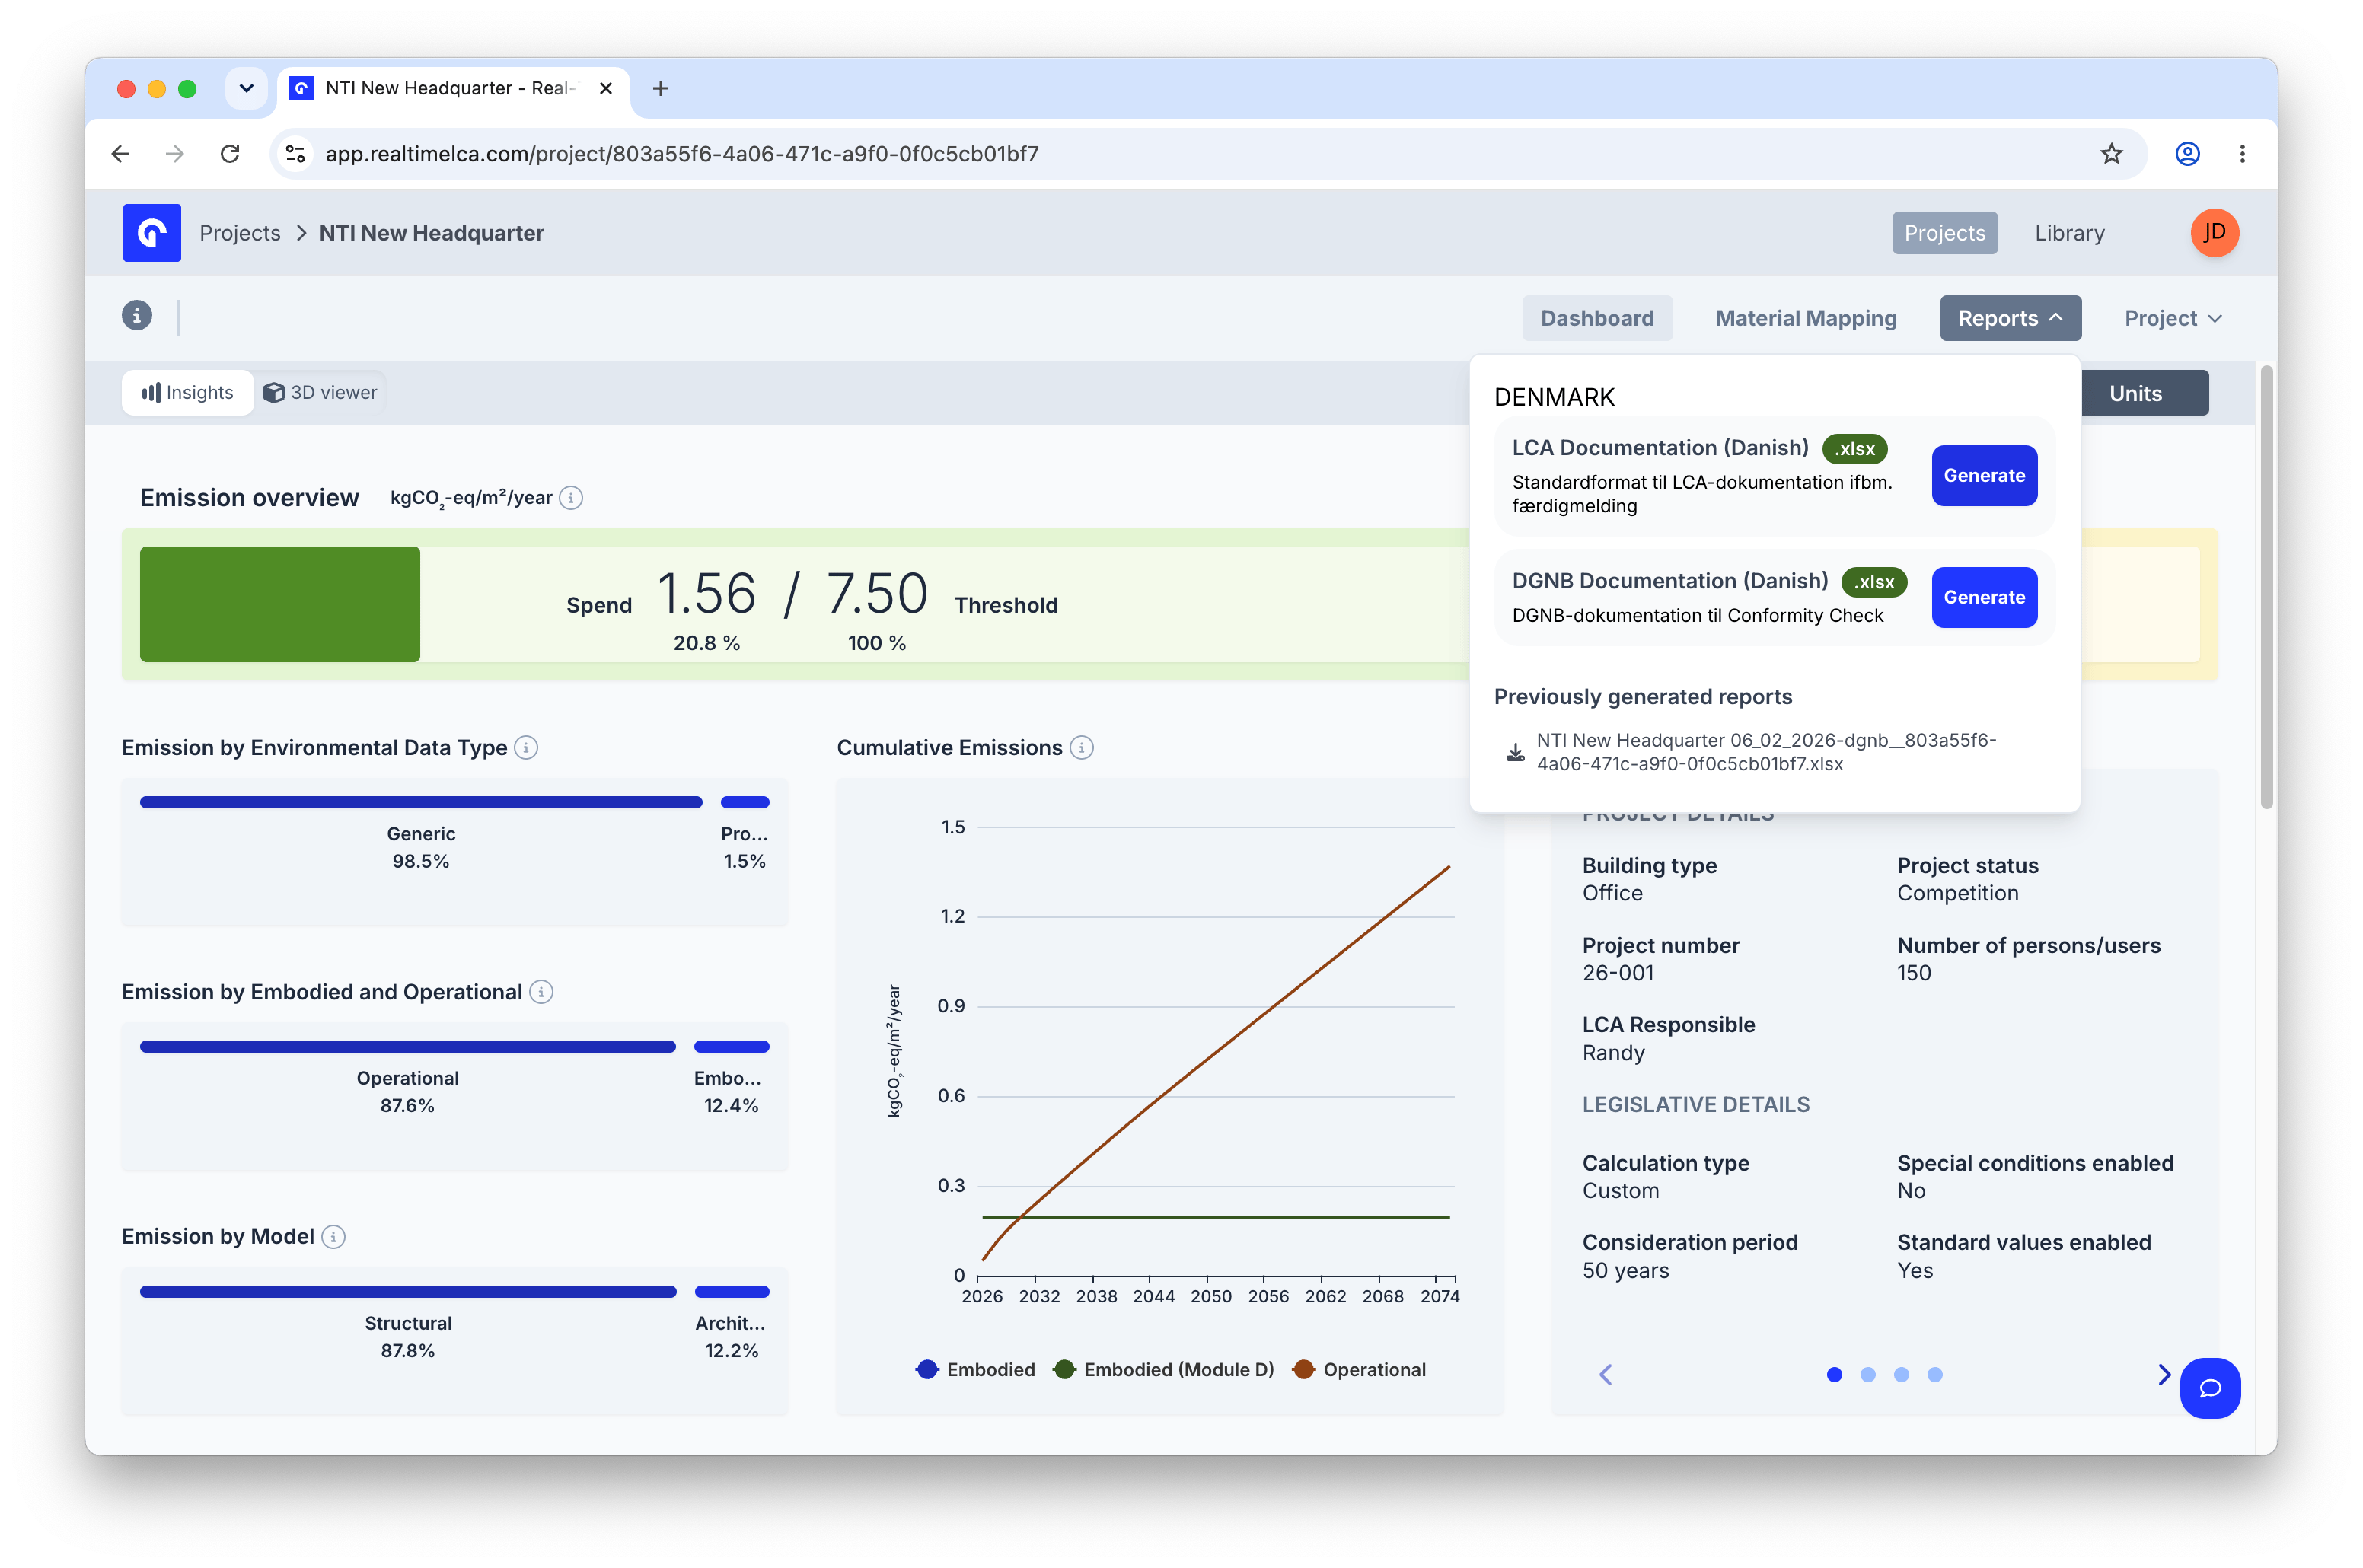 Each framework has a **Generate** button that builds a fresh report from the current calculation. Previously generated reports are listed below so you can re-download an older version.
### Downloading
Each framework has a **Generate** button that builds a fresh report from the current calculation. Previously generated reports are listed below so you can re-download an older version.
### Downloading
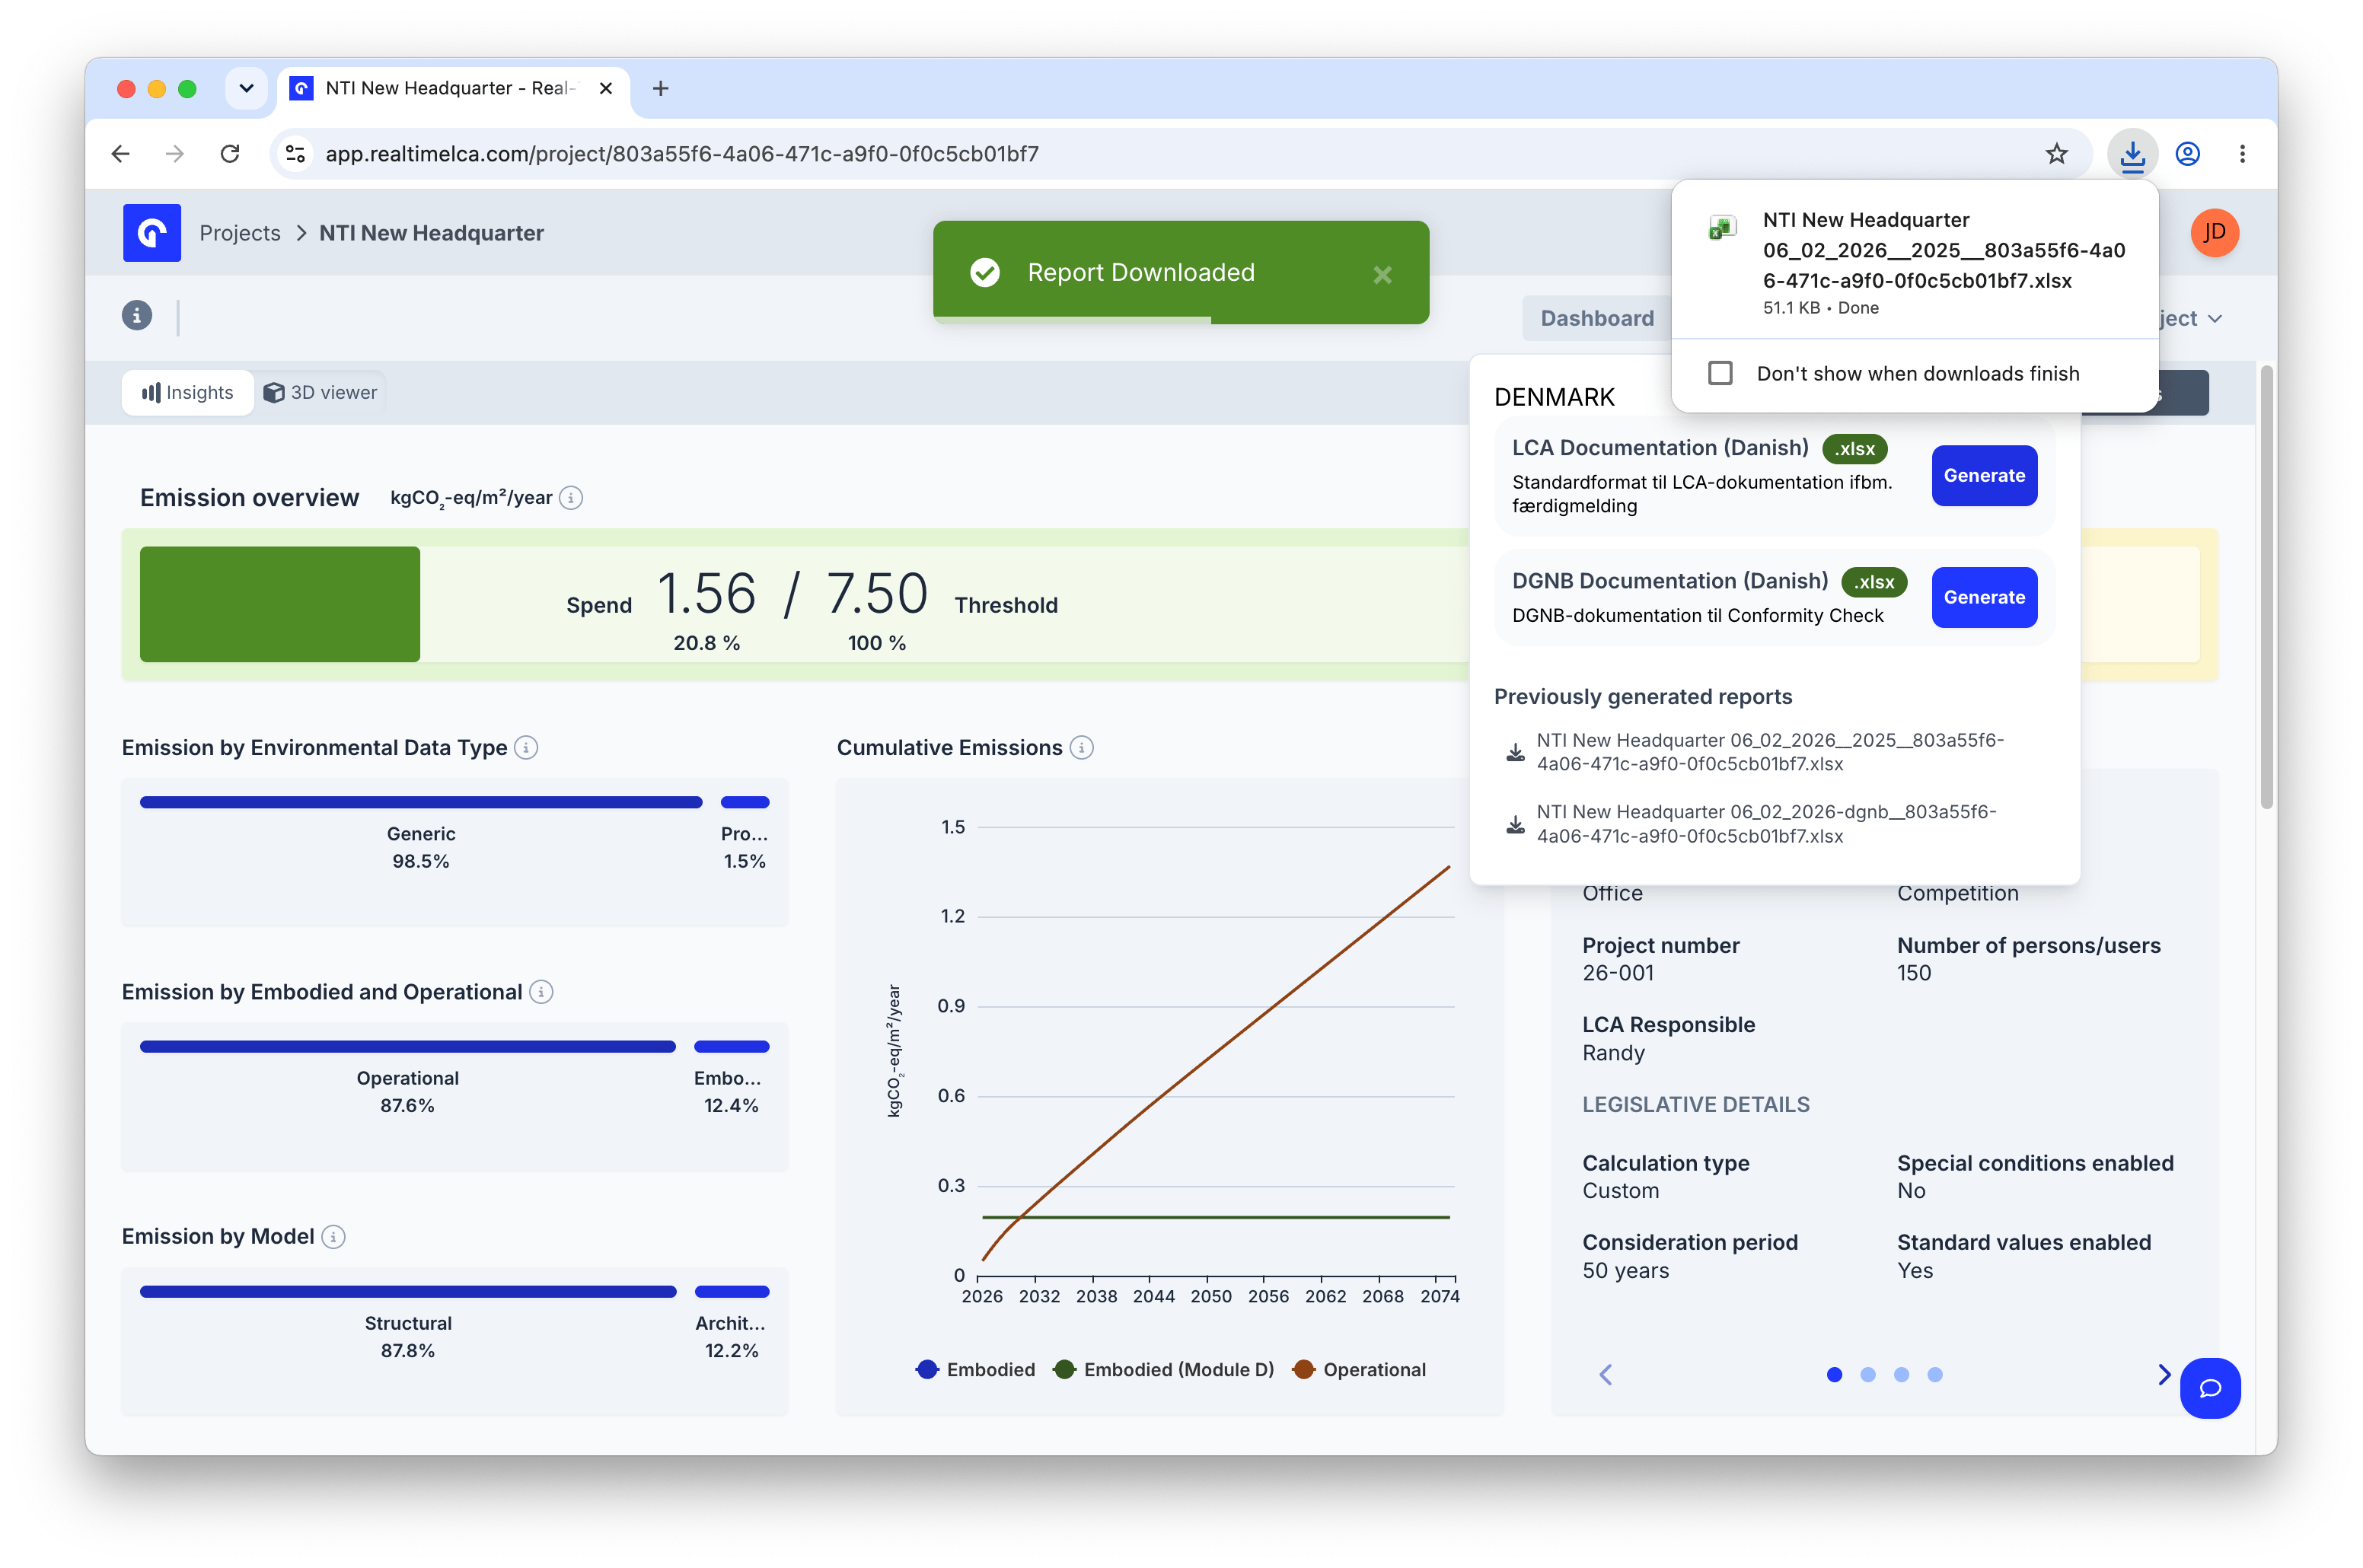 When a report is ready, a **Report Downloaded** toast appears at the top of the page and the file lands in your browser's downloads.
### Download as Excel
When a report is ready, a **Report Downloaded** toast appears at the top of the page and the file lands in your browser's downloads.
### Download as Excel
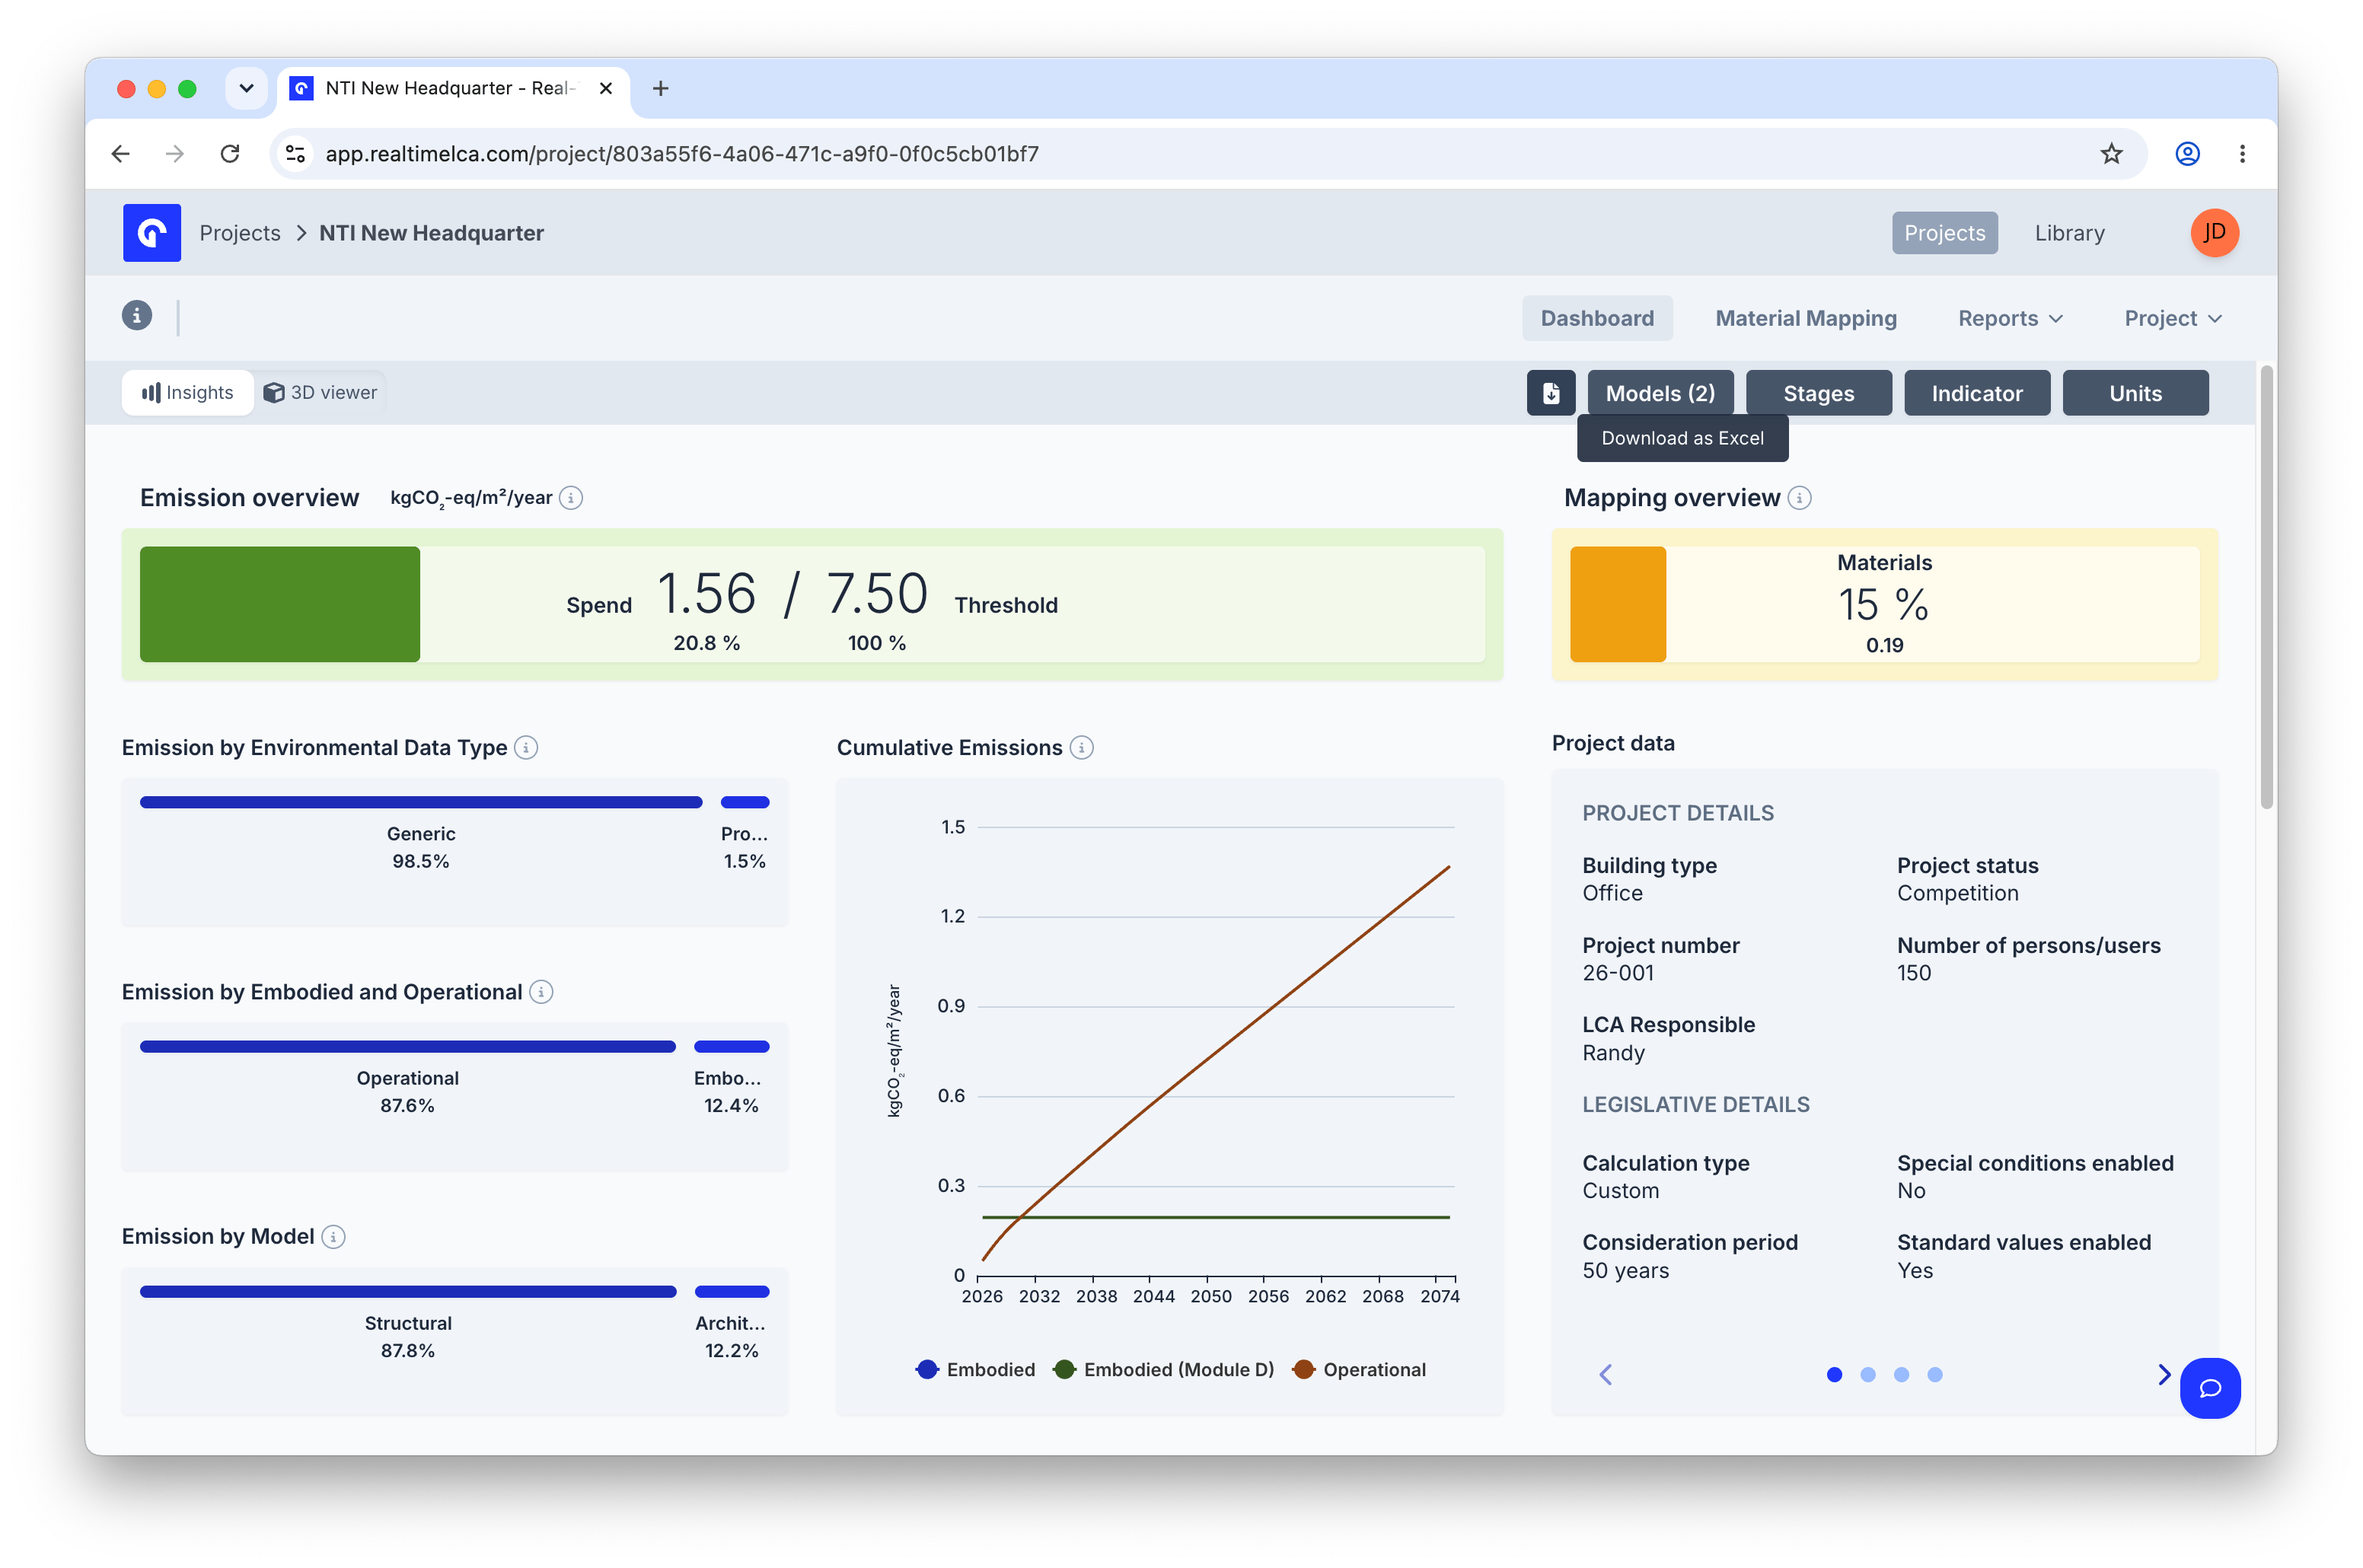 The spreadsheet icon next to the filter pills exports the current view — including filter selections — as an `.xlsx` file. Use this for an ad-hoc snapshot when you don't need a full framework report.
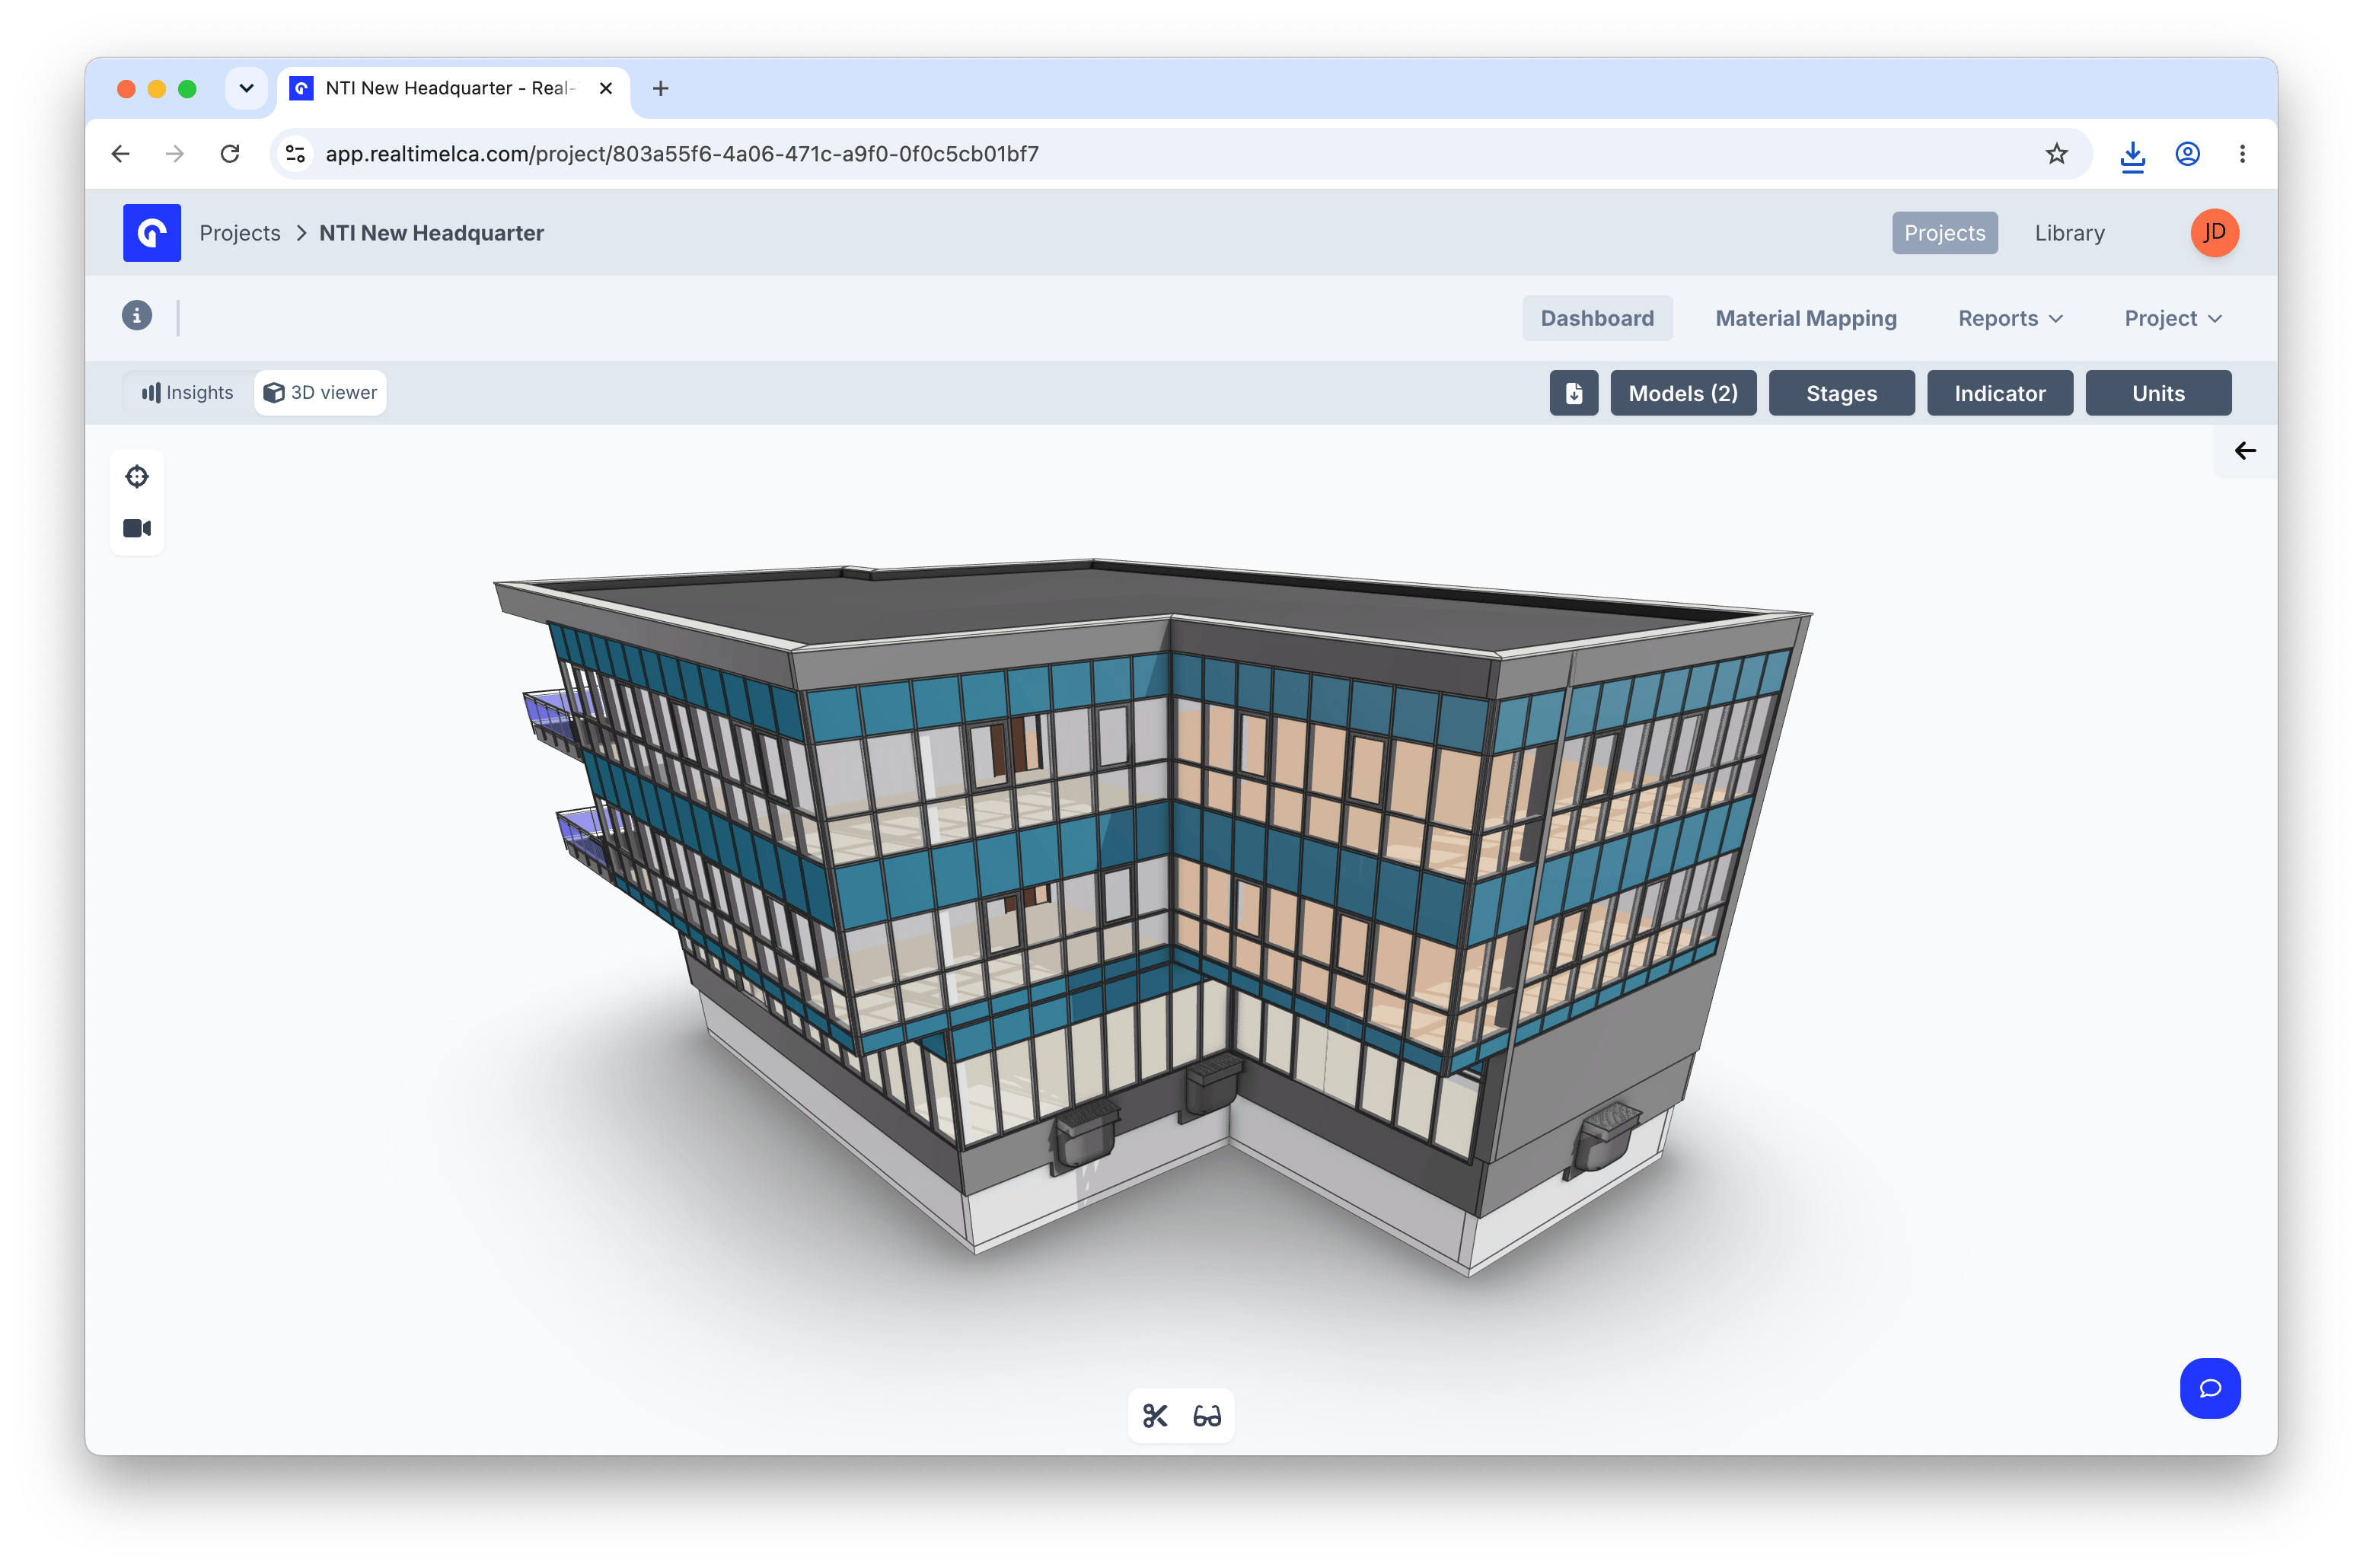
## 3D viewer
Toggle **3D viewer** in the top-left of the dashboard to swap the Insights charts for the building model. Use the mouse to orbit, pan, and zoom; the two icons under the canvas open the **section** and **camera presets** tools.
The spreadsheet icon next to the filter pills exports the current view — including filter selections — as an `.xlsx` file. Use this for an ad-hoc snapshot when you don't need a full framework report.
## 3D viewer
Toggle **3D viewer** in the top-left of the dashboard to swap the Insights charts for the building model. Use the mouse to orbit, pan, and zoom; the two icons under the canvas open the **section** and **camera presets** tools.
 ### Insights panel
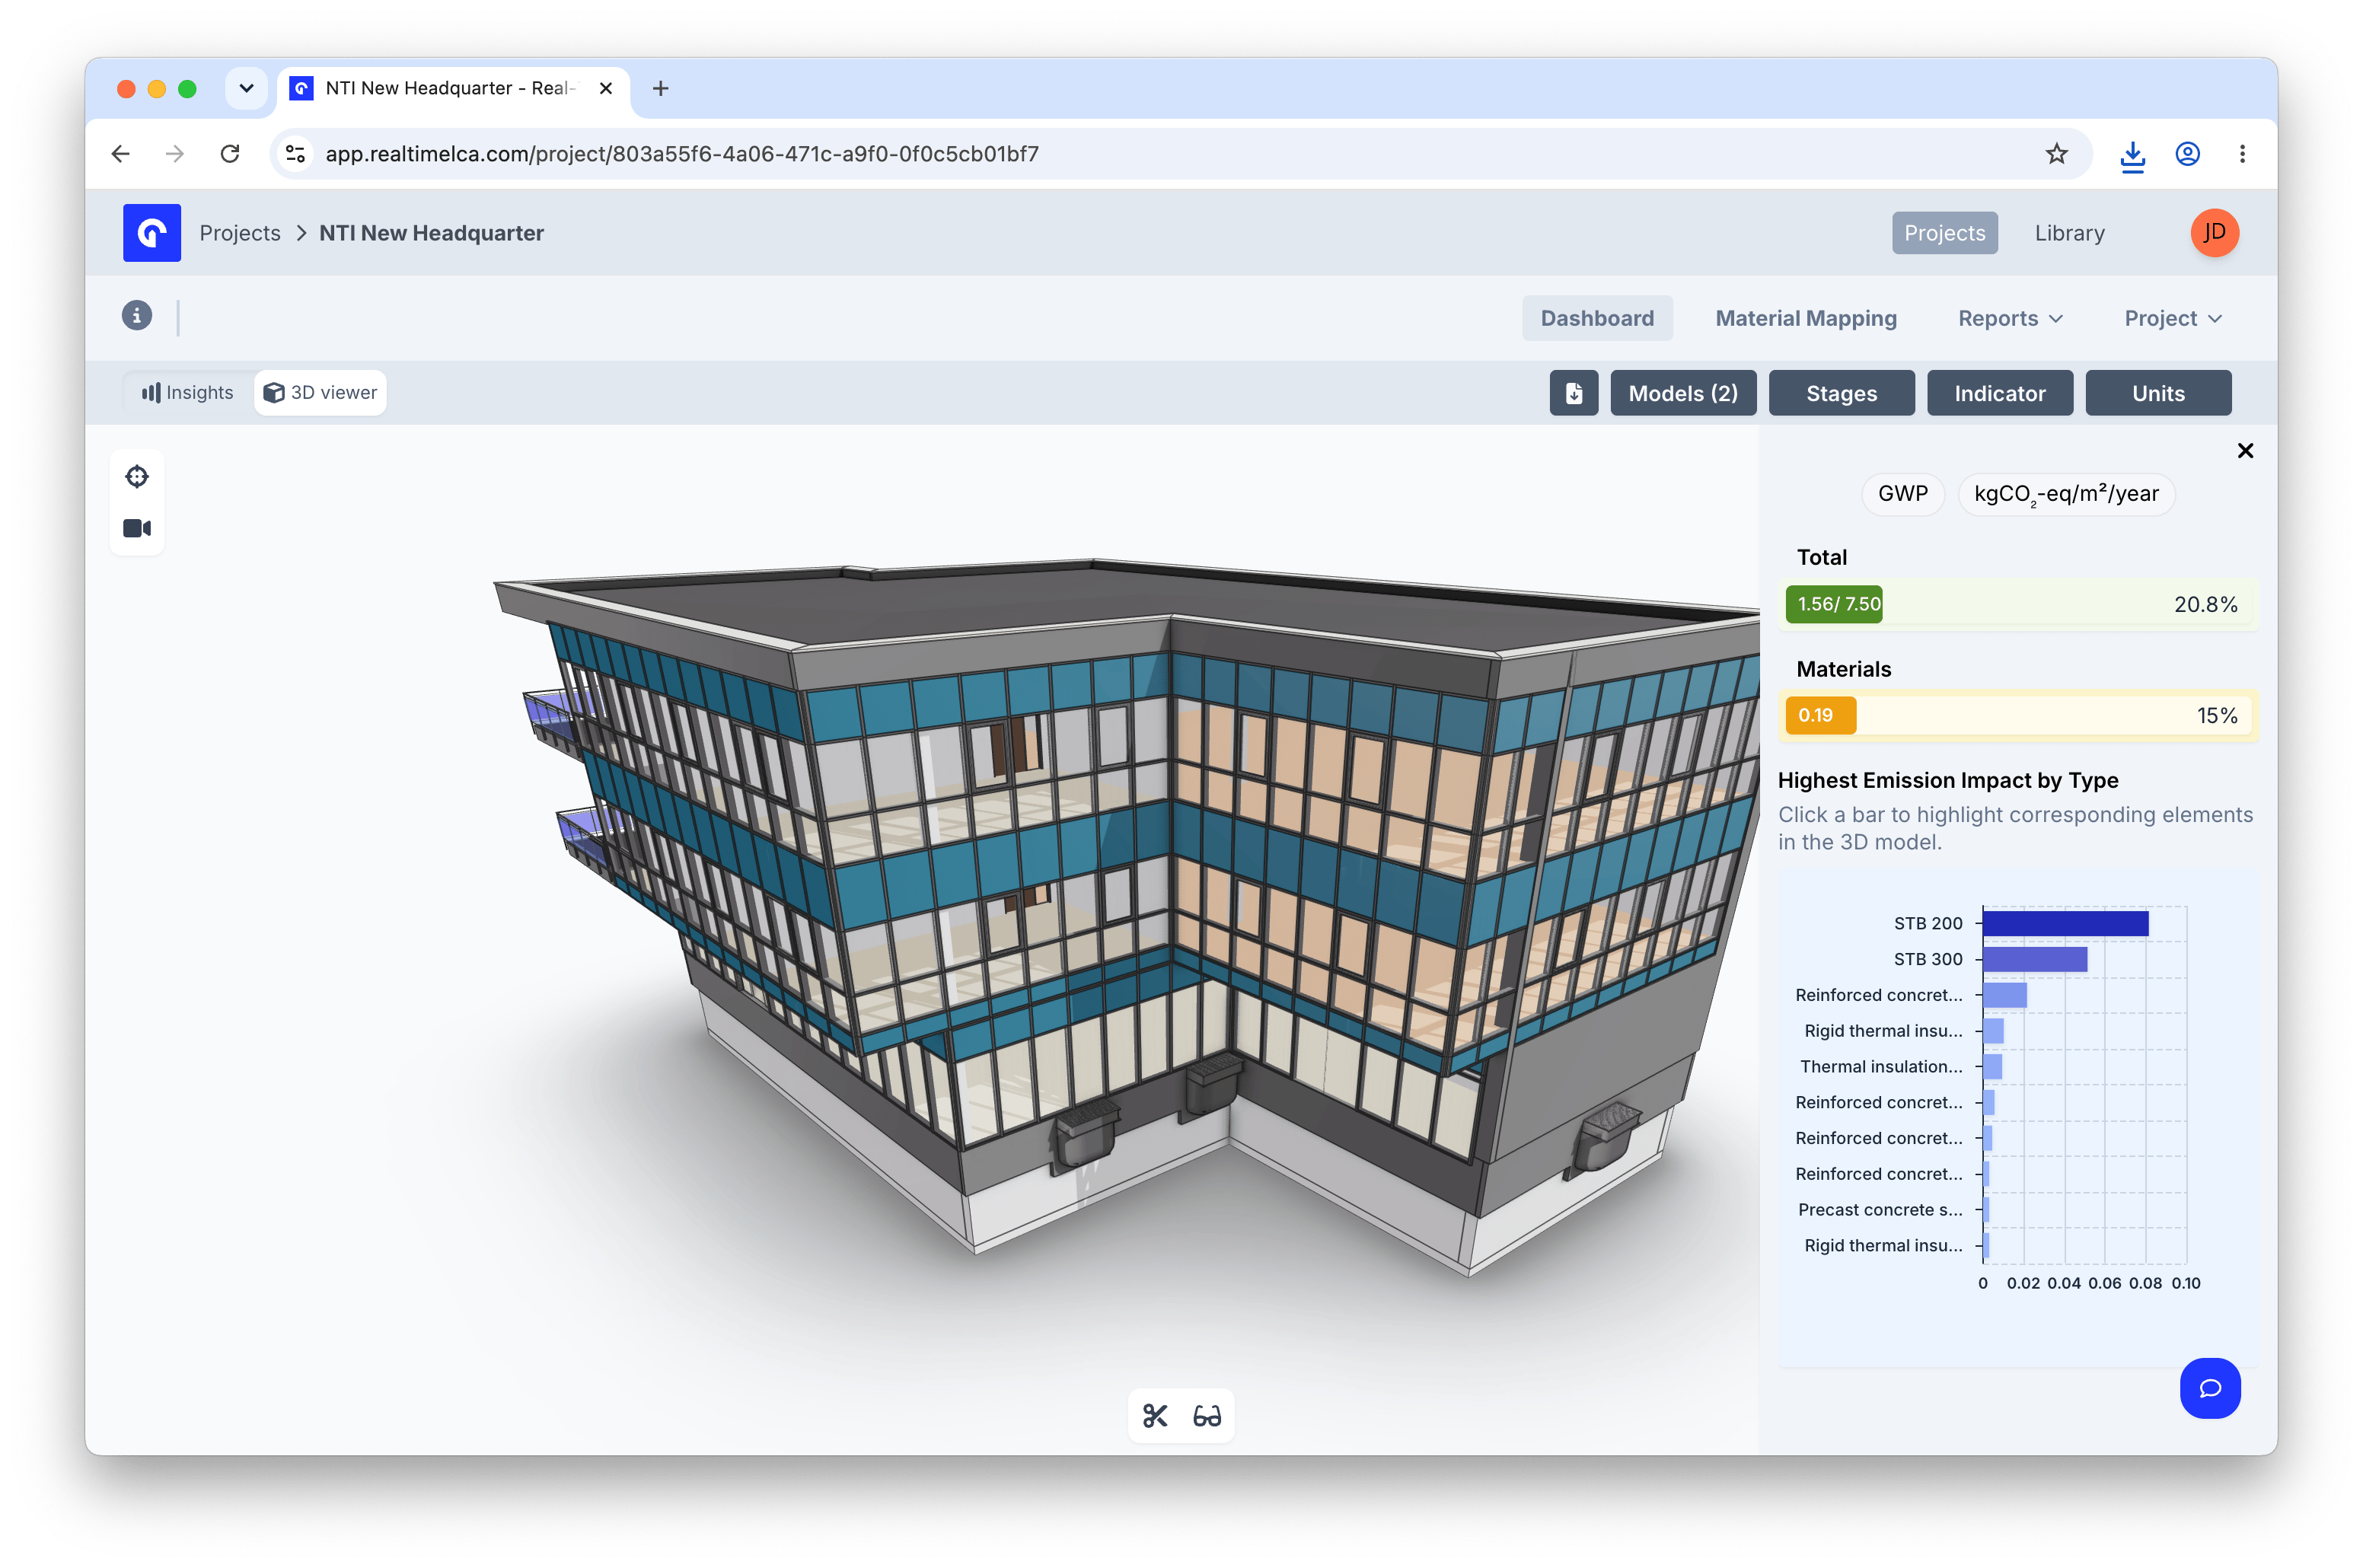 The right-hand panel mirrors the Insights overview's headline indicators (**Total**, **Materials**) and shows the **Highest Emission Impact by Type** hotspot.
### Filter the model from a chart
The right-hand panel mirrors the Insights overview's headline indicators (**Total**, **Materials**) and shows the **Highest Emission Impact by Type** hotspot.
### Filter the model from a chart
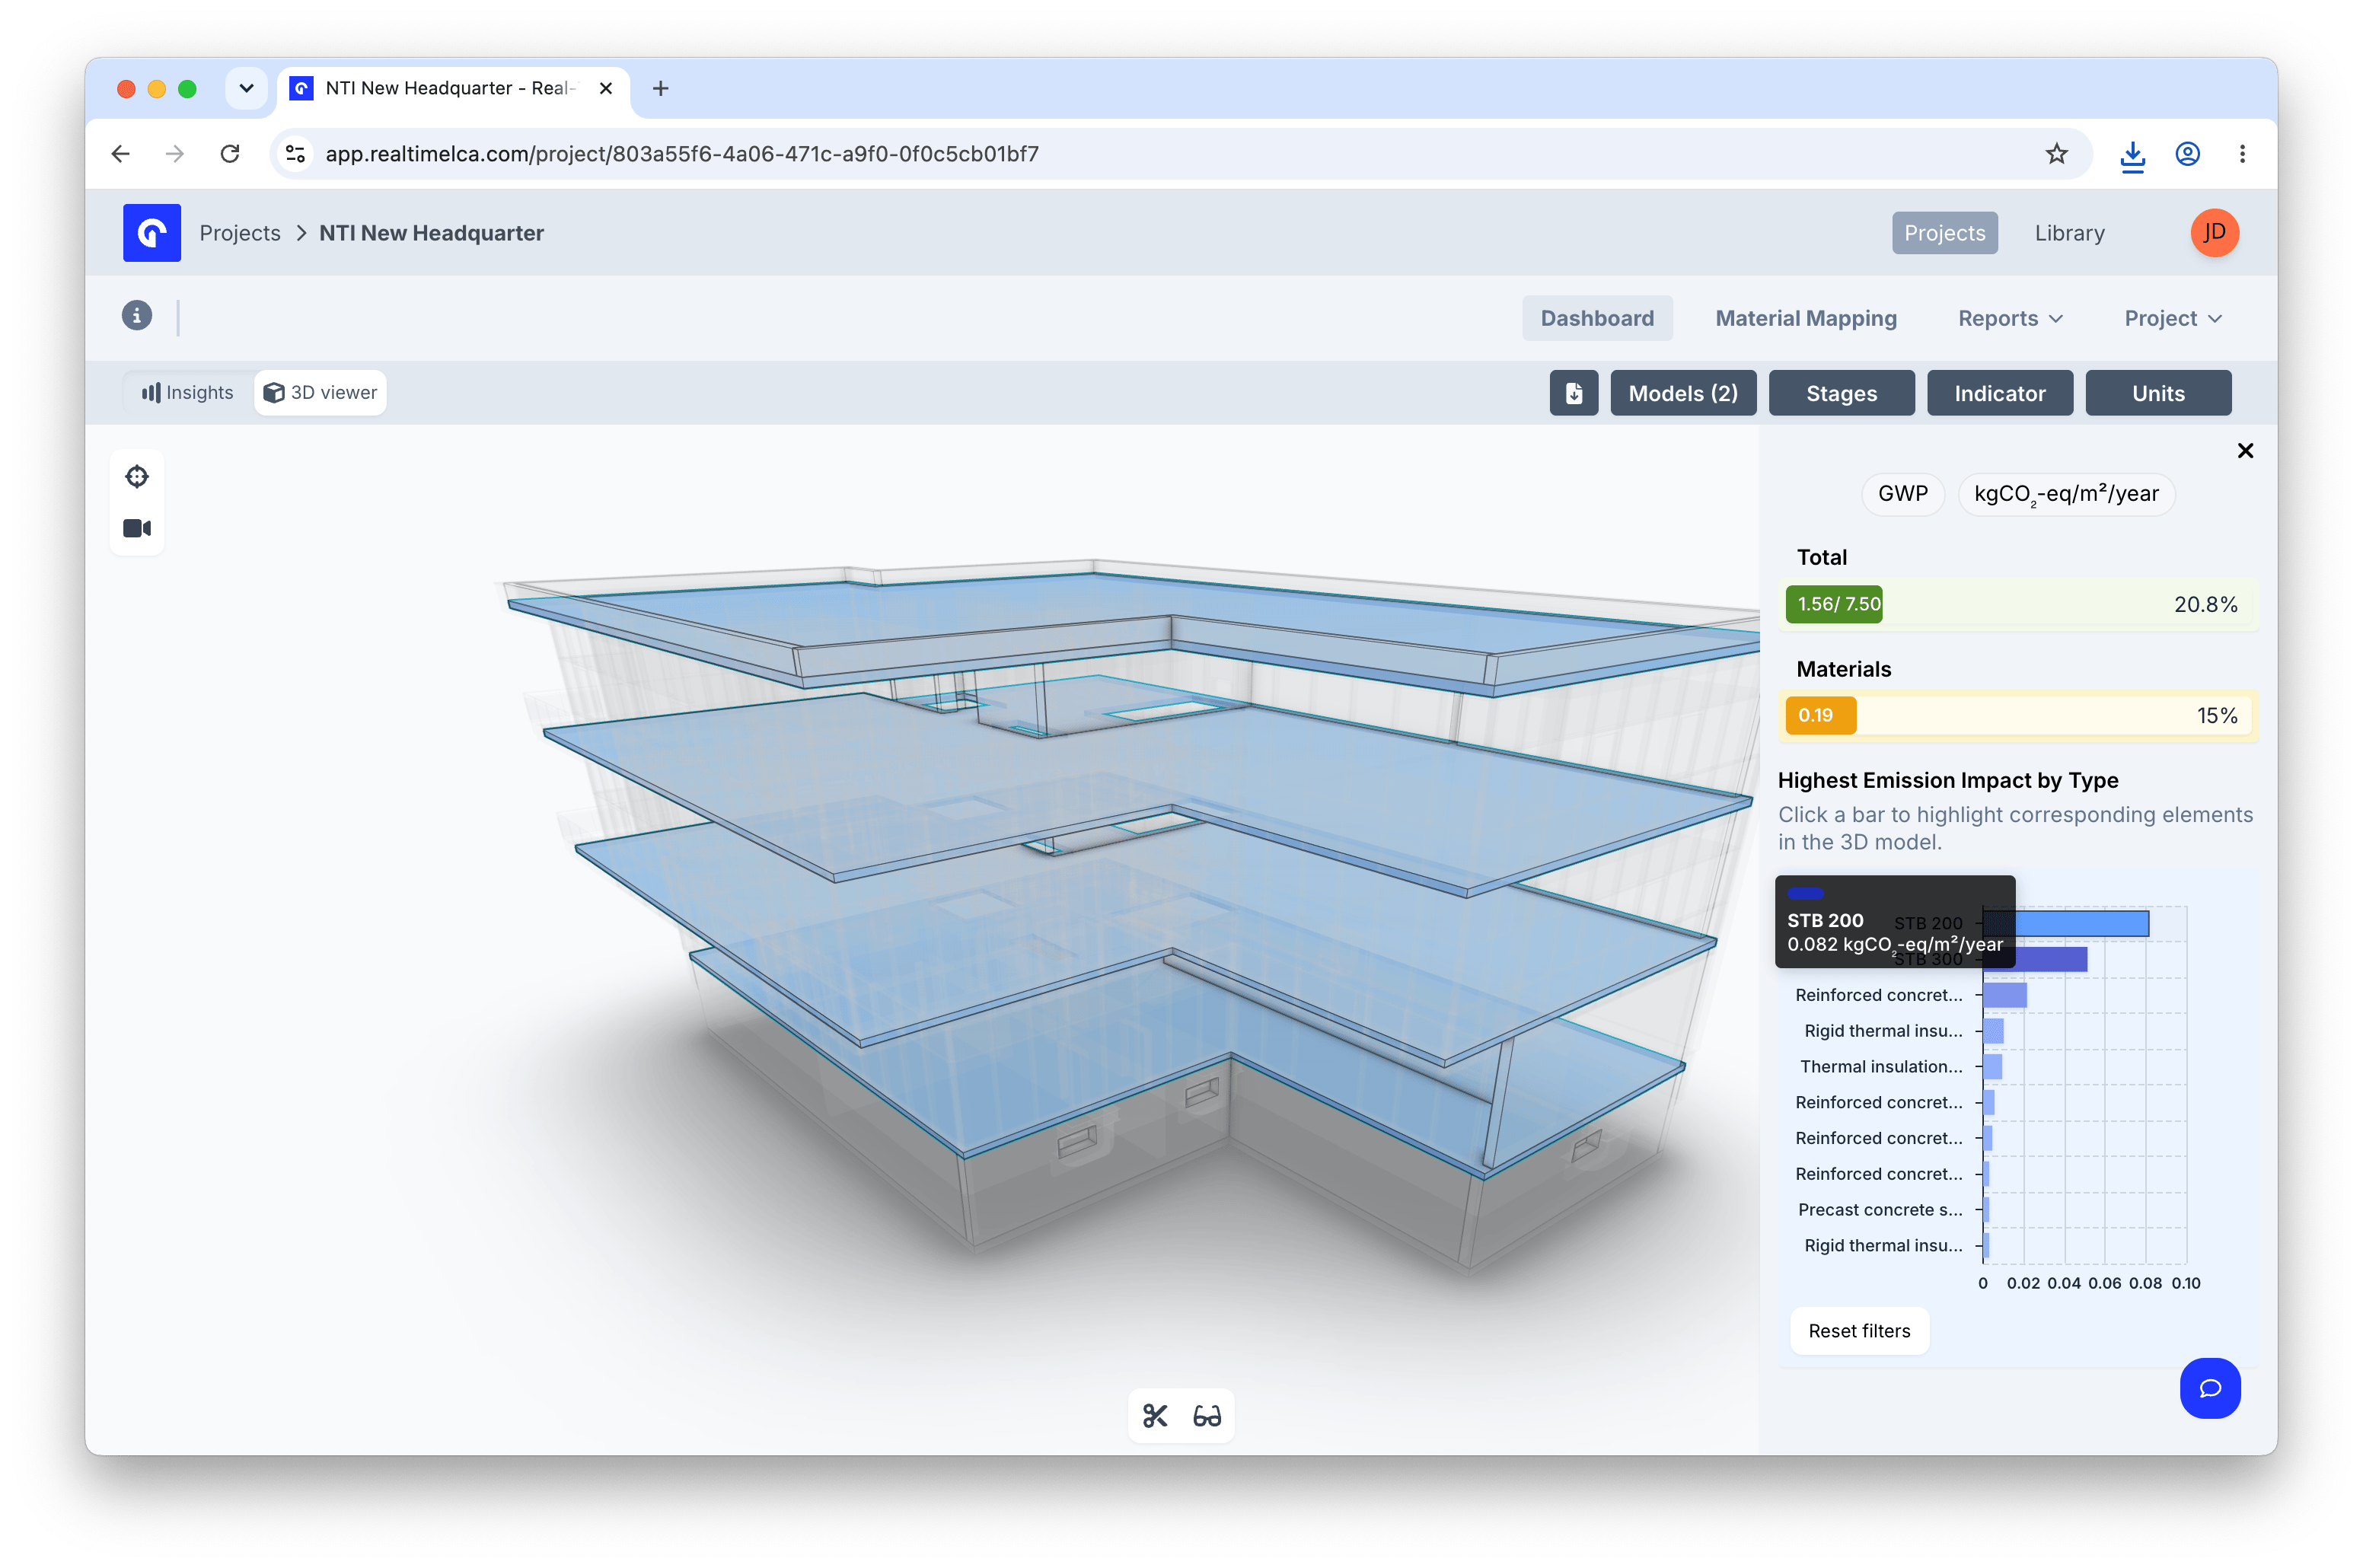 Selecting a bar in any side-panel chart filters the 3D model to just the matching elements — the floors explode along the vertical axis so the selection is visible from any angle, and the tooltip shows that element's emission contribution. Use **Reset filters** in the side panel to clear the selection.
### Camera presets
Selecting a bar in any side-panel chart filters the 3D model to just the matching elements — the floors explode along the vertical axis so the selection is visible from any angle, and the tooltip shows that element's emission contribution. Use **Reset filters** in the side panel to clear the selection.
### Camera presets
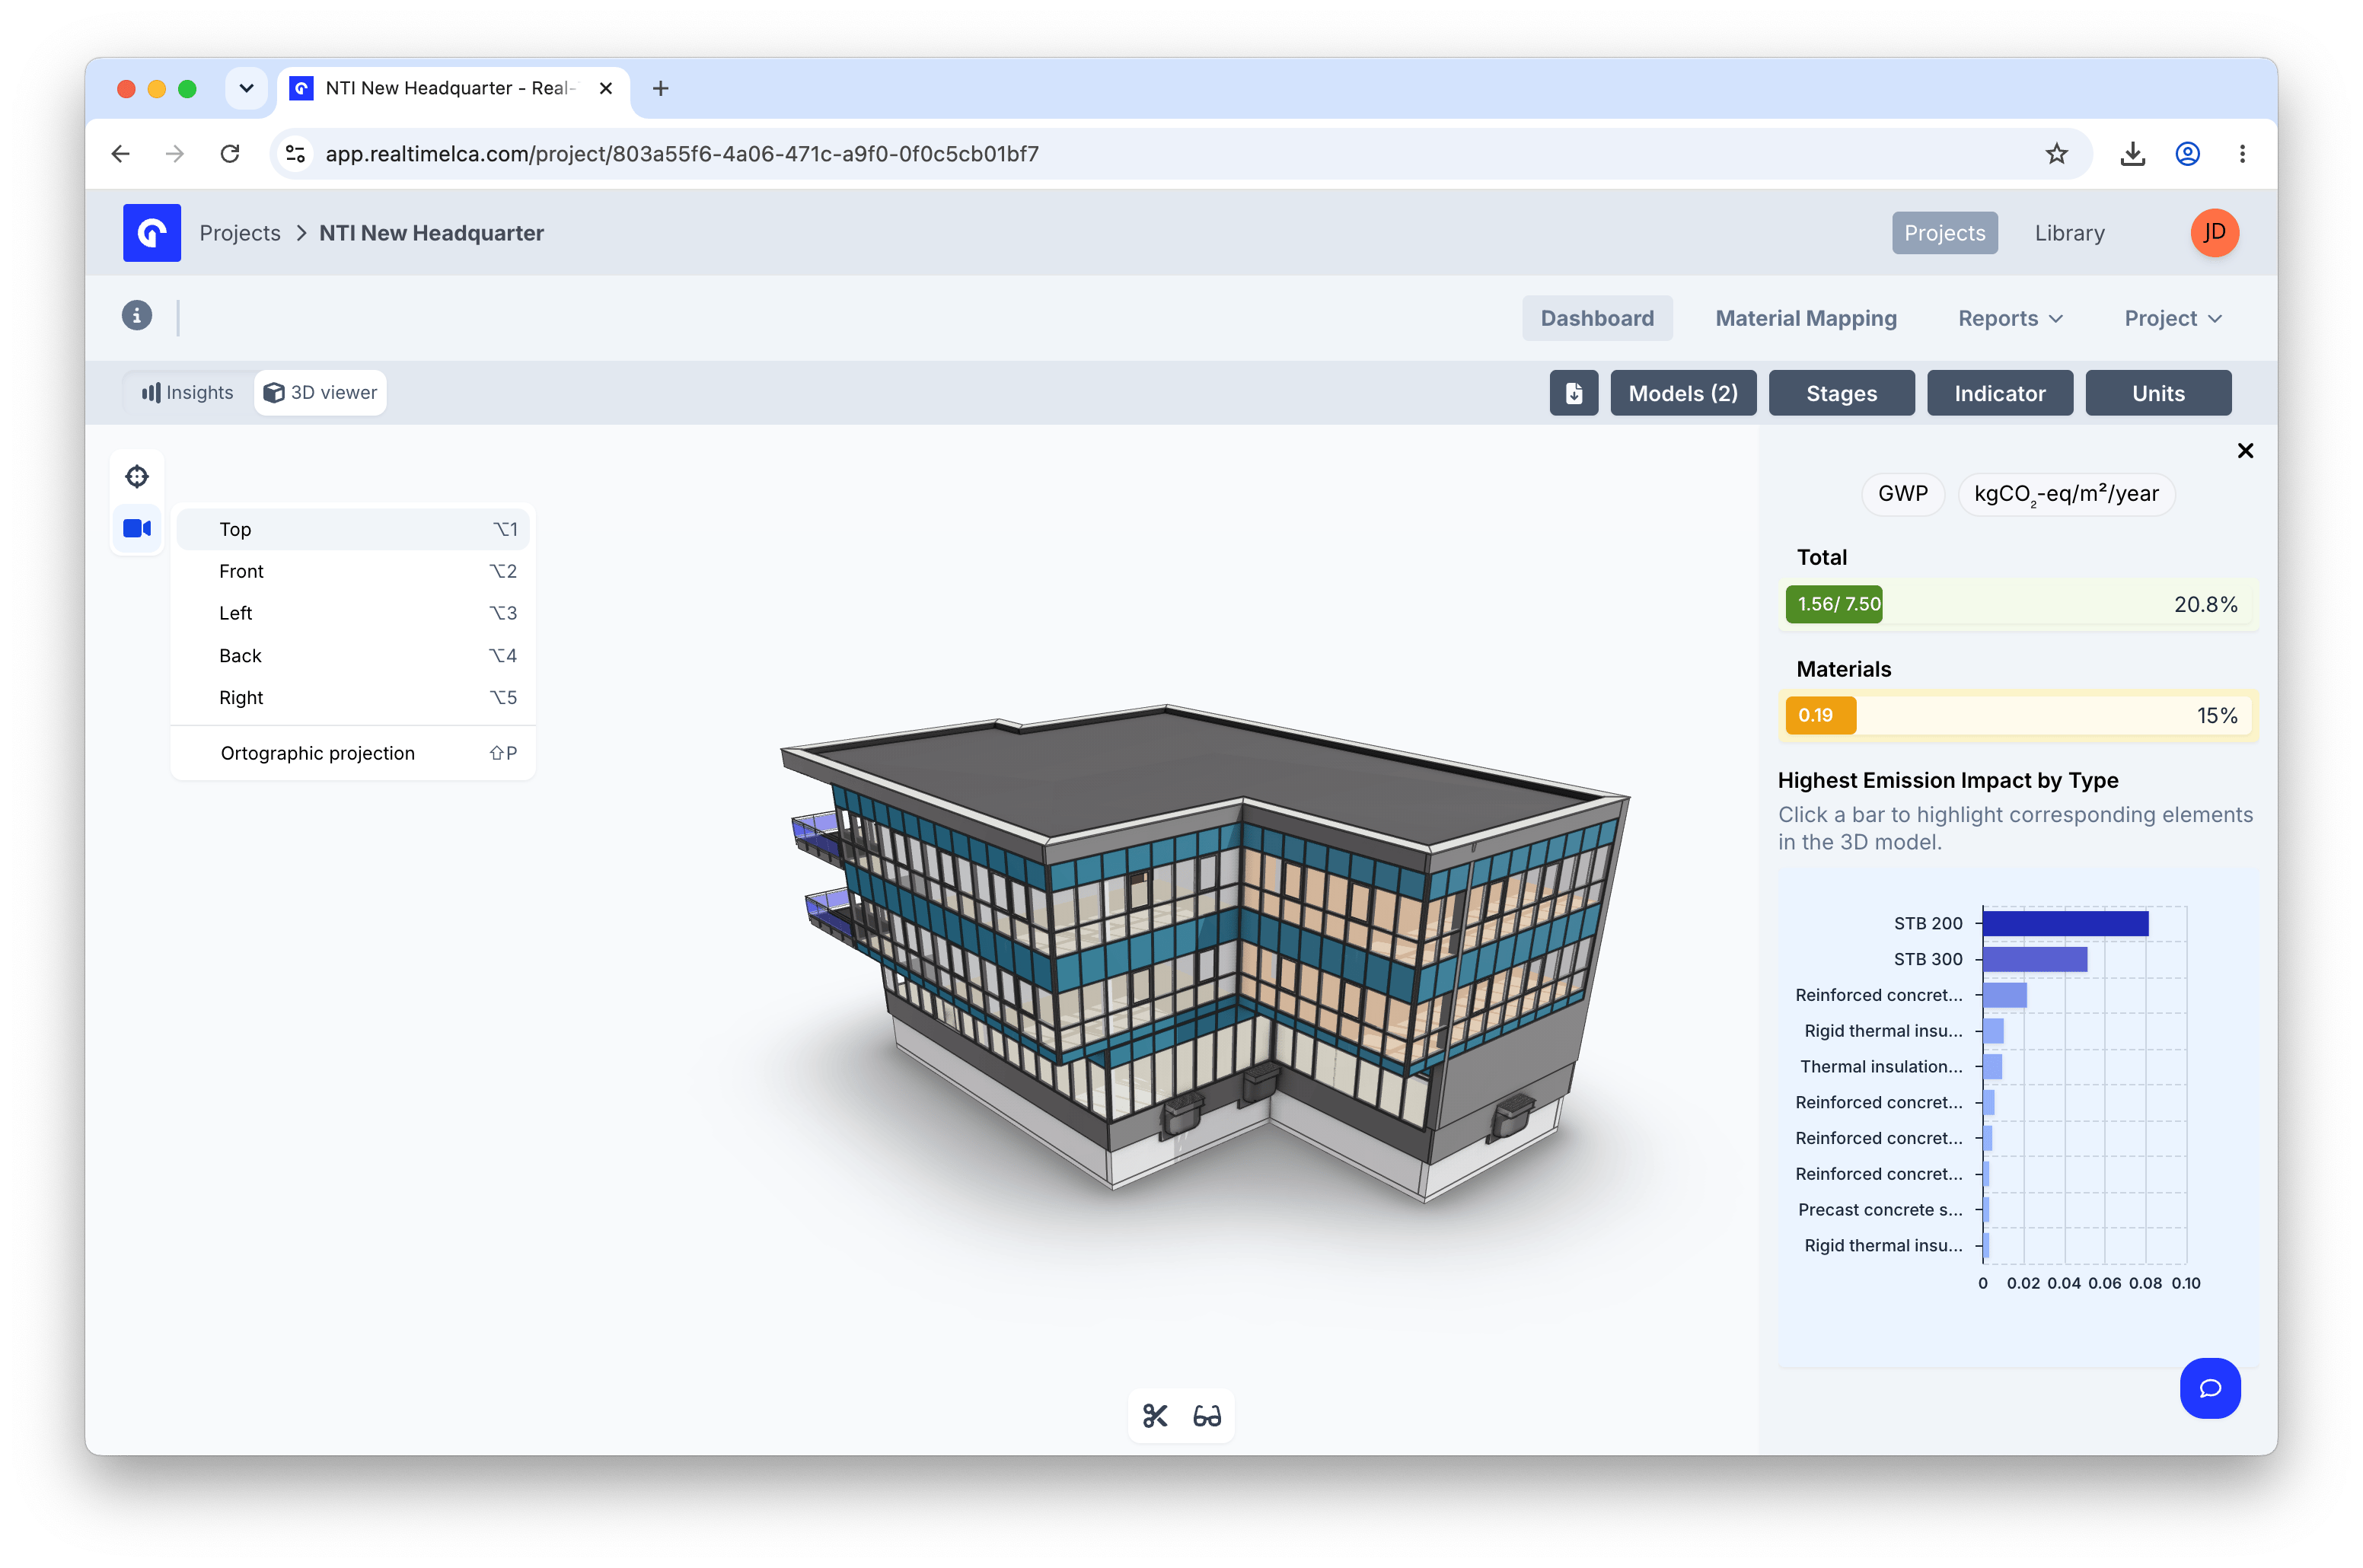 Open the camera presets to jump straight to a standard view — **Top**, **Front**, **Left**, **Back**, **Right** — or switch to **Orthographic projection** for measurement-friendly views without perspective distortion.
### View modes
Open the camera presets to jump straight to a standard view — **Top**, **Front**, **Left**, **Back**, **Right** — or switch to **Orthographic projection** for measurement-friendly views without perspective distortion.
### View modes
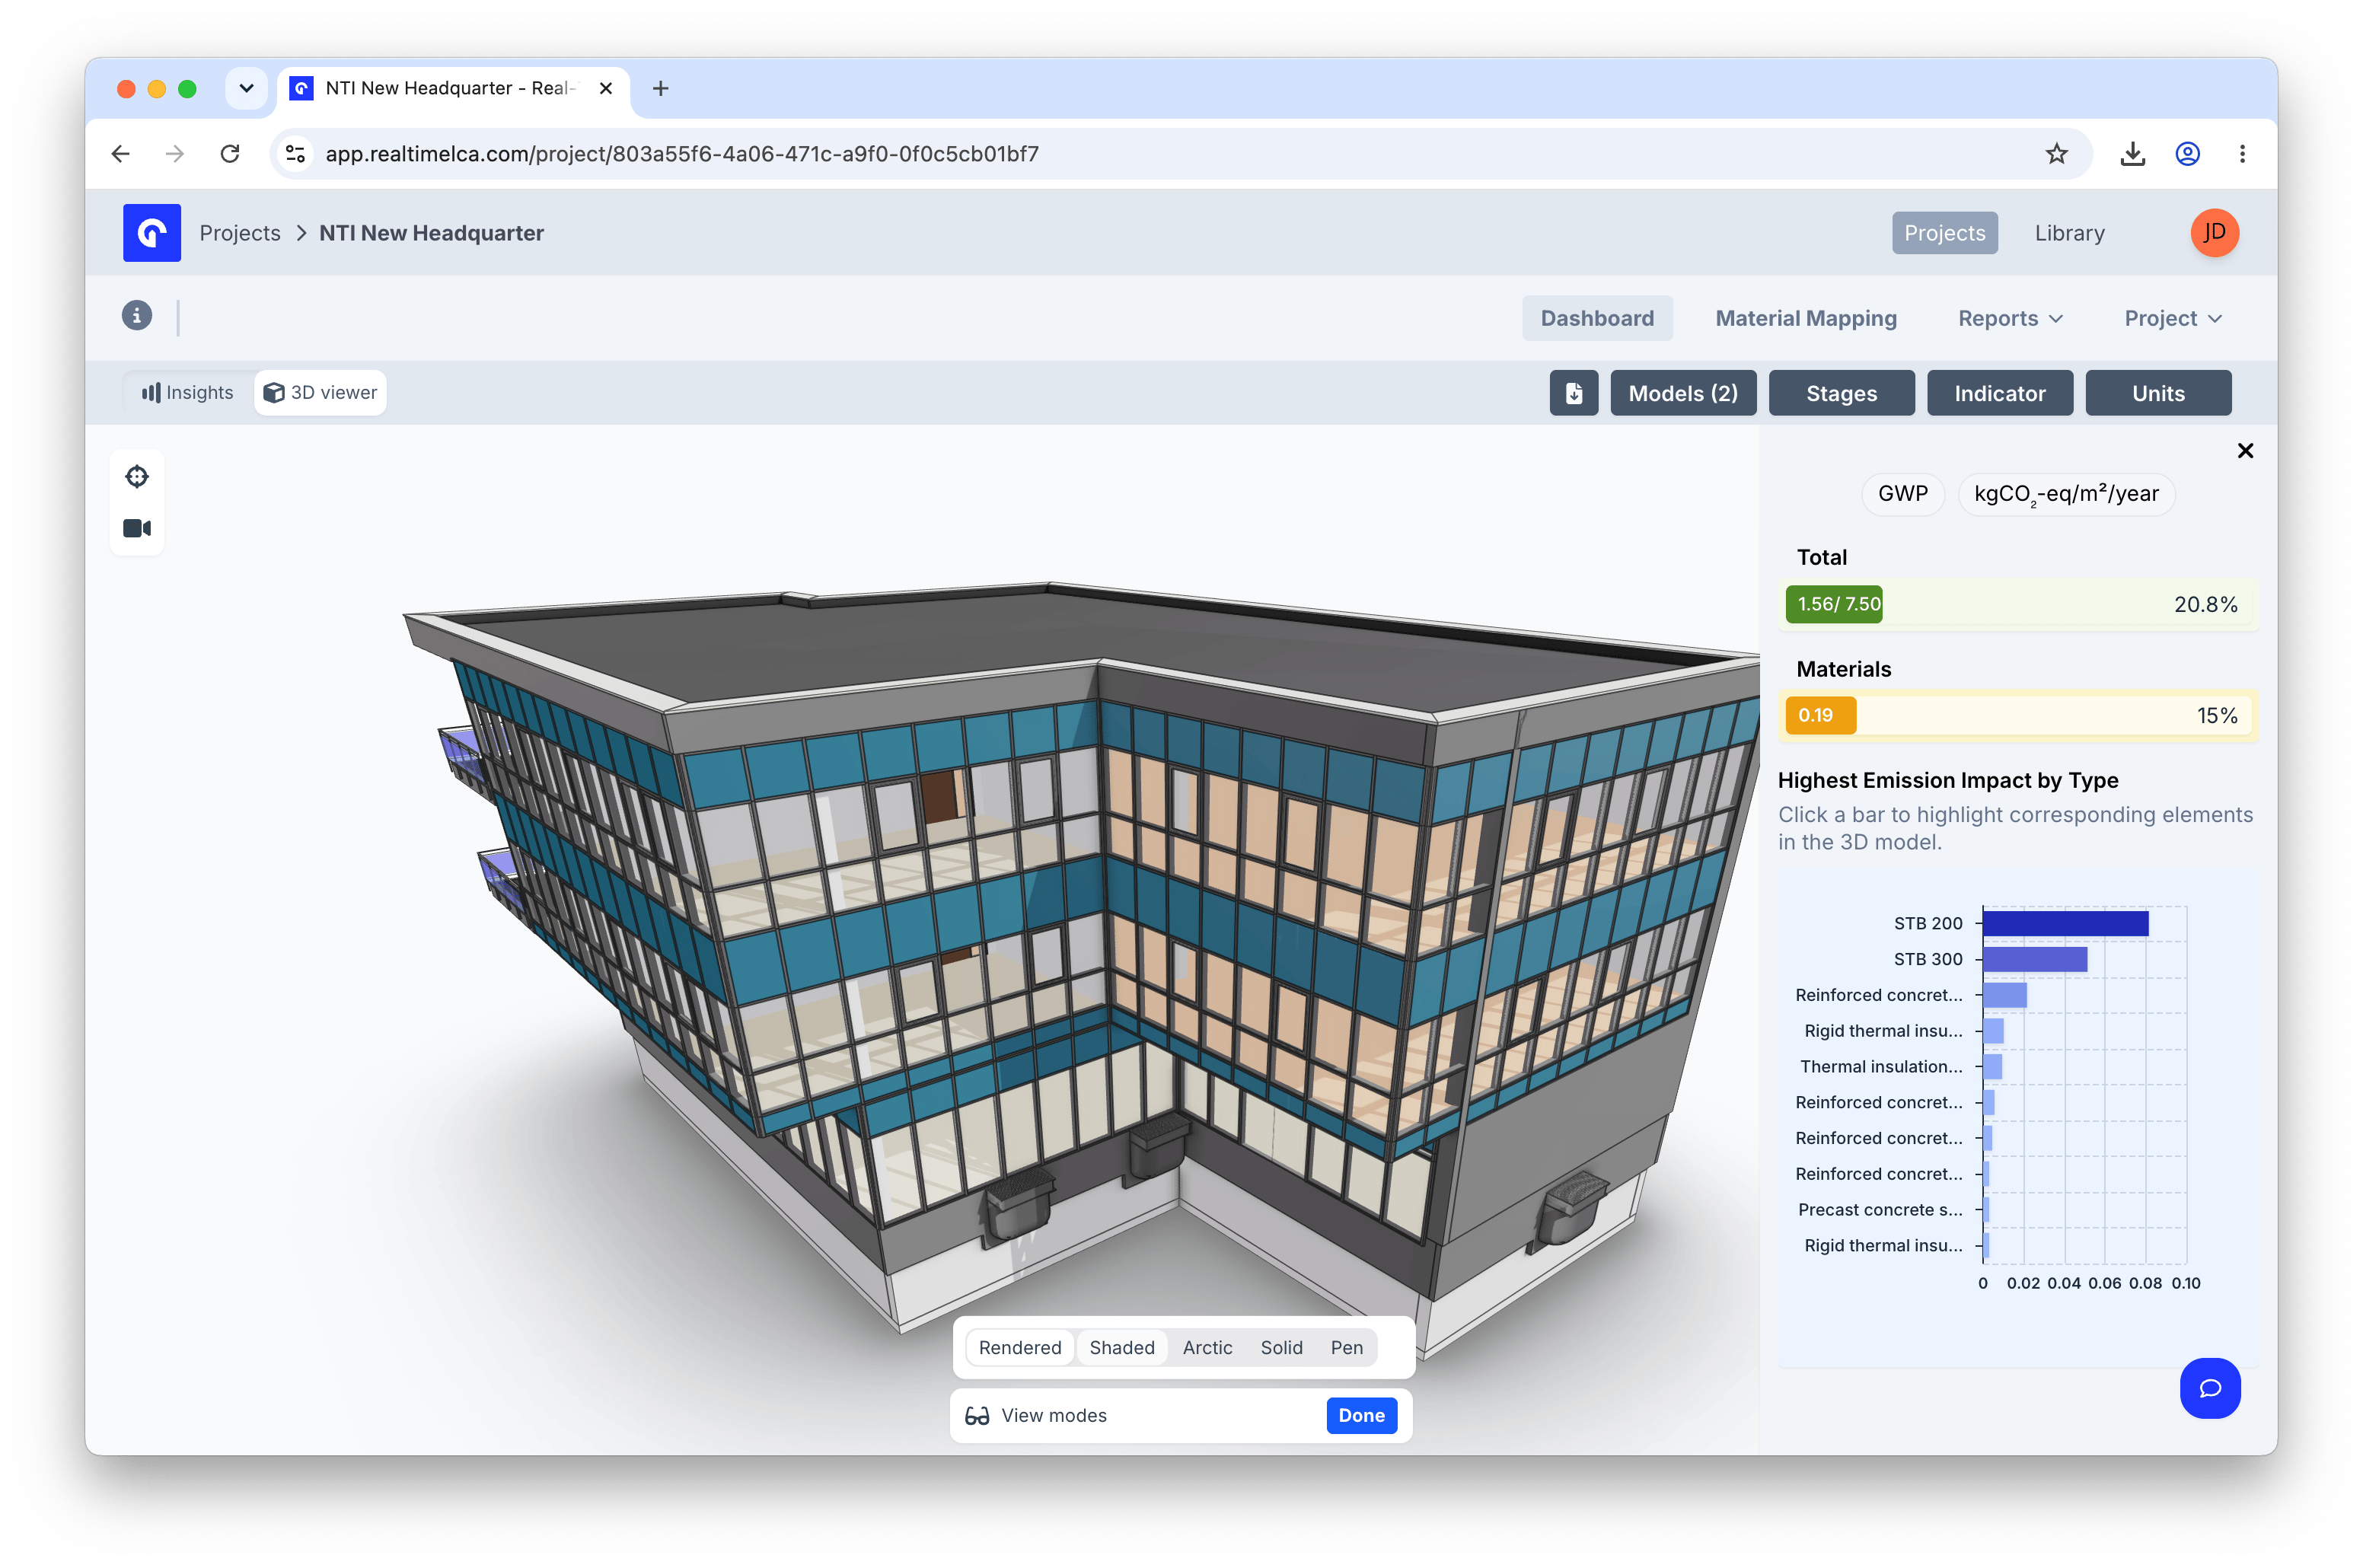 Switch how the model is shaded: **Rendered**, **Shaded**, **Arctic**, **Solid**, or **Pen**. Use Solid or Arctic when you want a flat, high-contrast view to spot the highlighted hotspot elements.
### Section tool
Switch how the model is shaded: **Rendered**, **Shaded**, **Arctic**, **Solid**, or **Pen**. Use Solid or Arctic when you want a flat, high-contrast view to spot the highlighted hotspot elements.
### Section tool
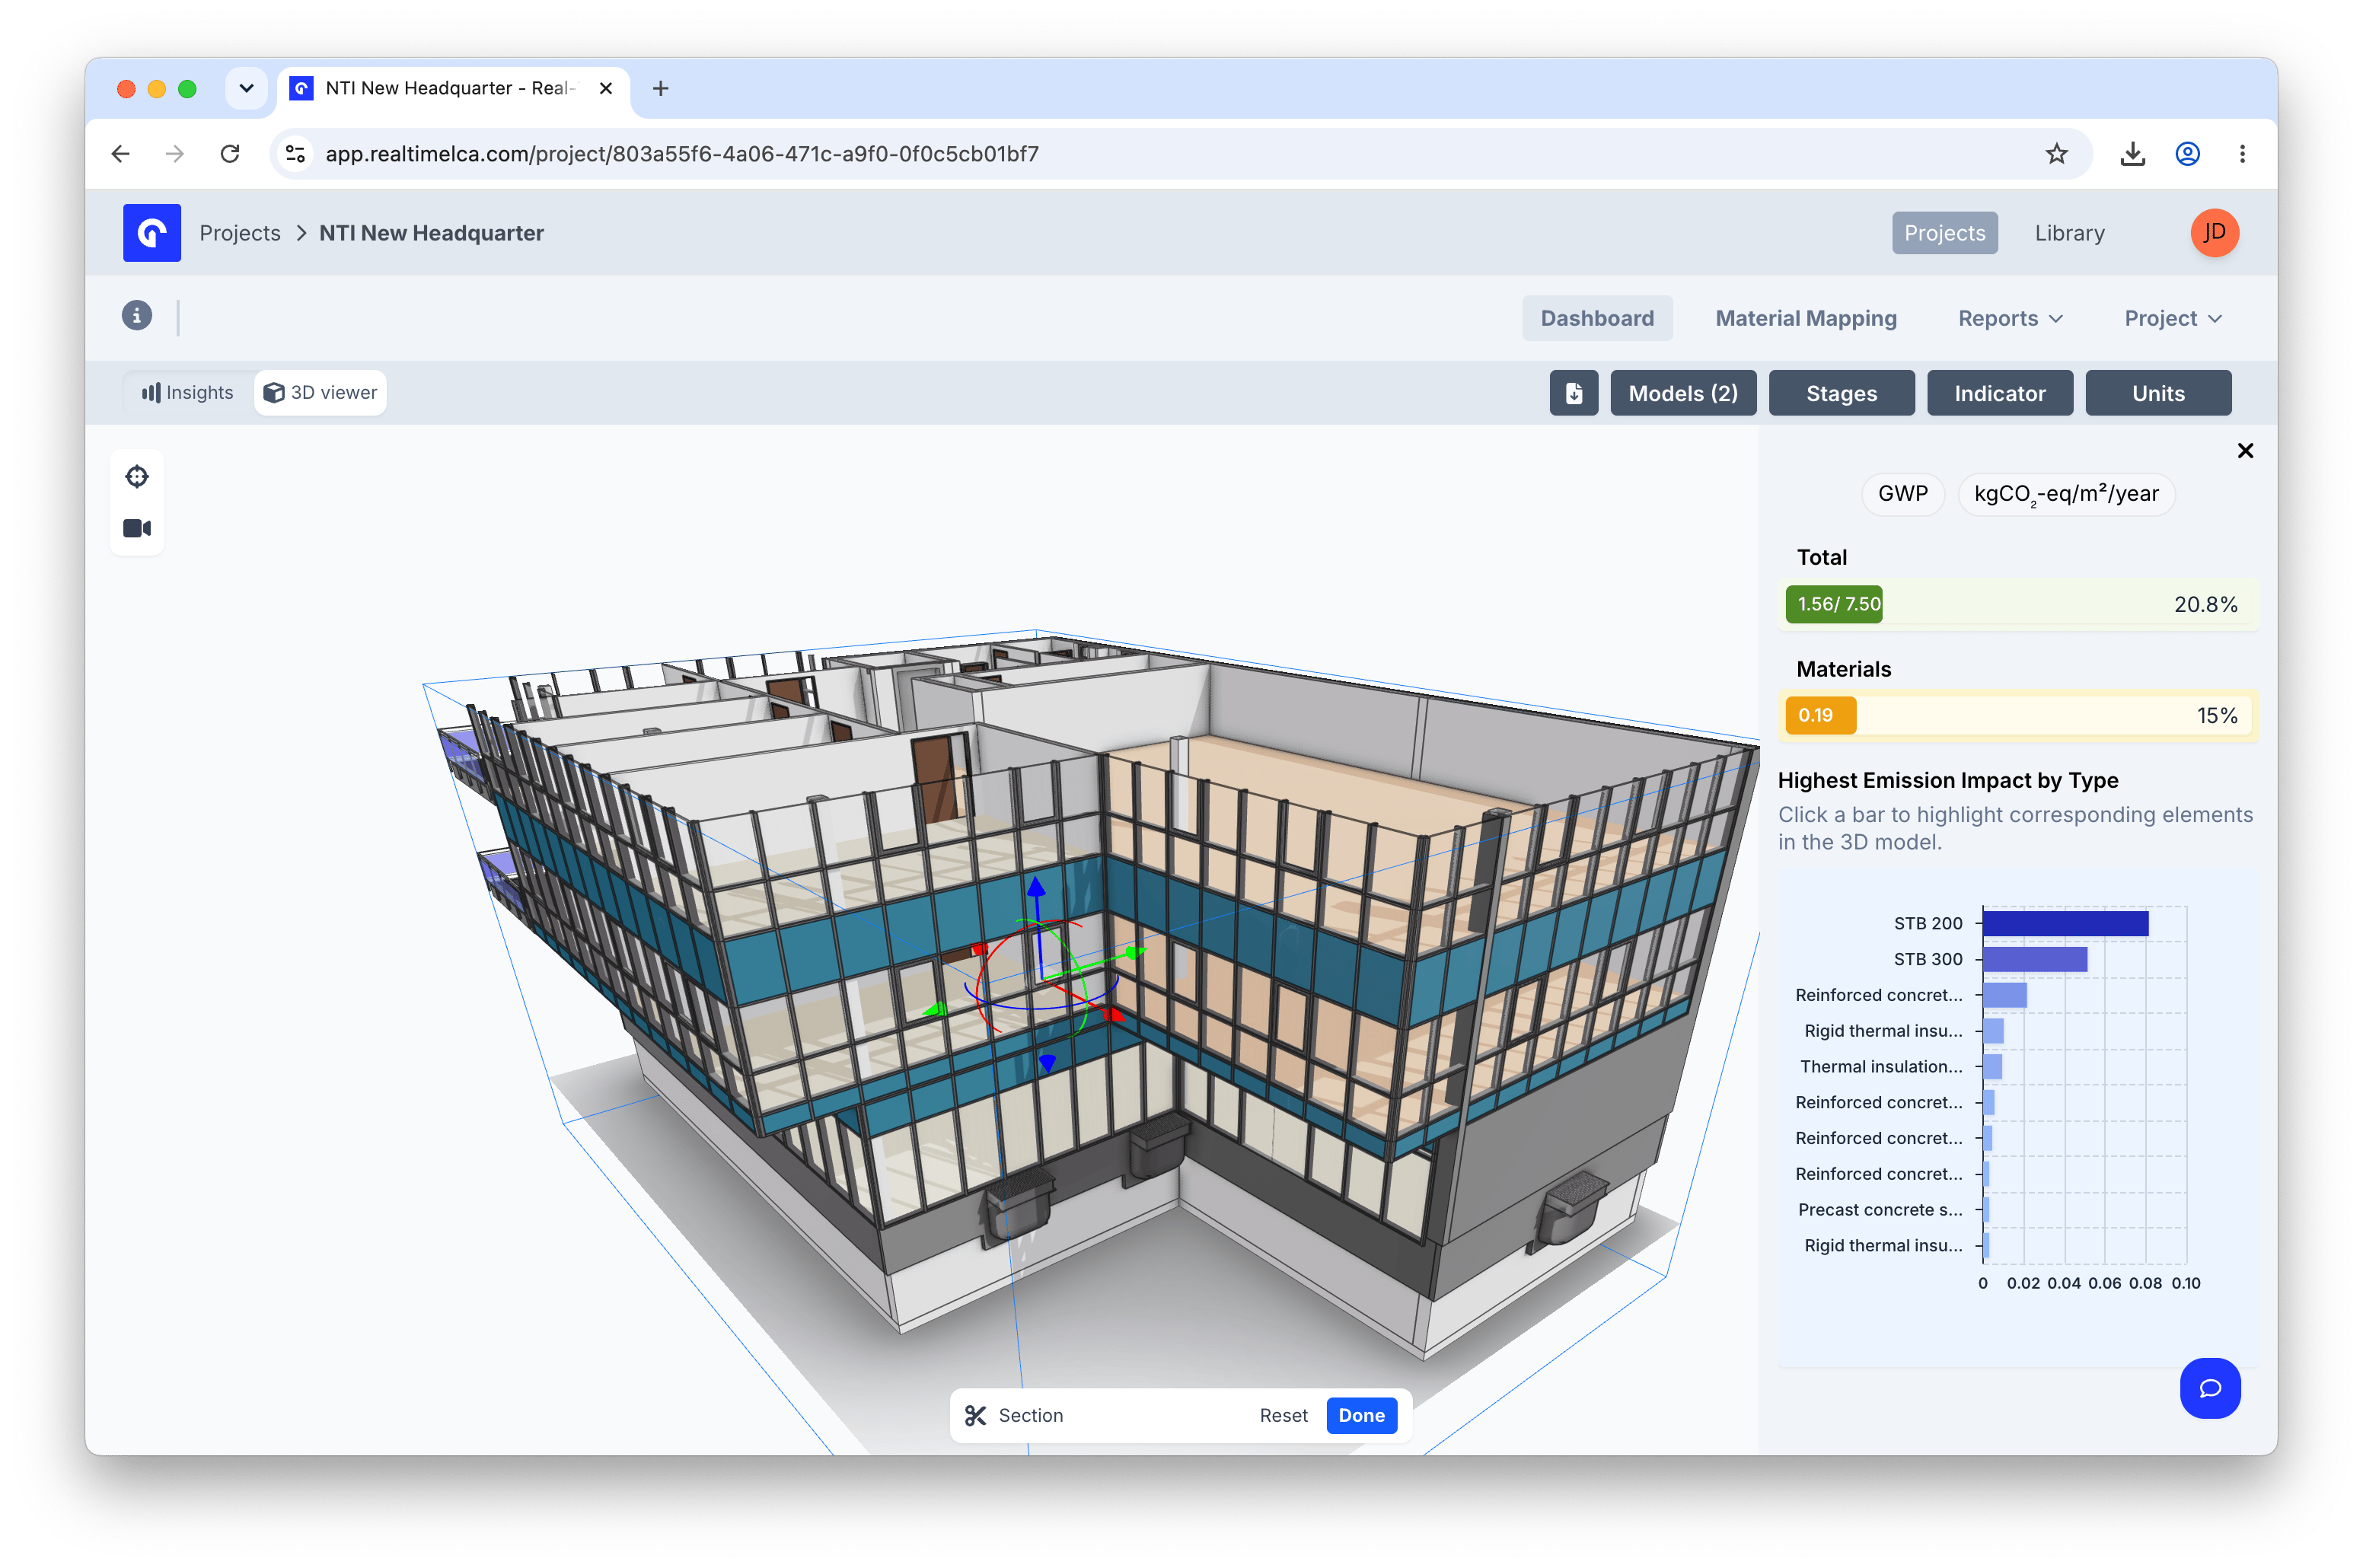 The section tool slices the model with a plane you can drag along any axis, exposing the interior. Use **Reset** in the bottom toolbar to clear the plane, or **Done** to keep it.
## Project settings
The **Project** tab in the dashboard header opens the project-level actions menu — **Manage Users**, **Edit Project**, **Clone Project**, and **Delete Project**. See [Project Settings](/user-guide/project/project-settings) for the full walkthrough of each action.
The section tool slices the model with a plane you can drag along any axis, exposing the interior. Use **Reset** in the bottom toolbar to clear the plane, or **Done** to keep it.
## Project settings
The **Project** tab in the dashboard header opens the project-level actions menu — **Manage Users**, **Edit Project**, **Clone Project**, and **Delete Project**. See [Project Settings](/user-guide/project/project-settings) for the full walkthrough of each action.